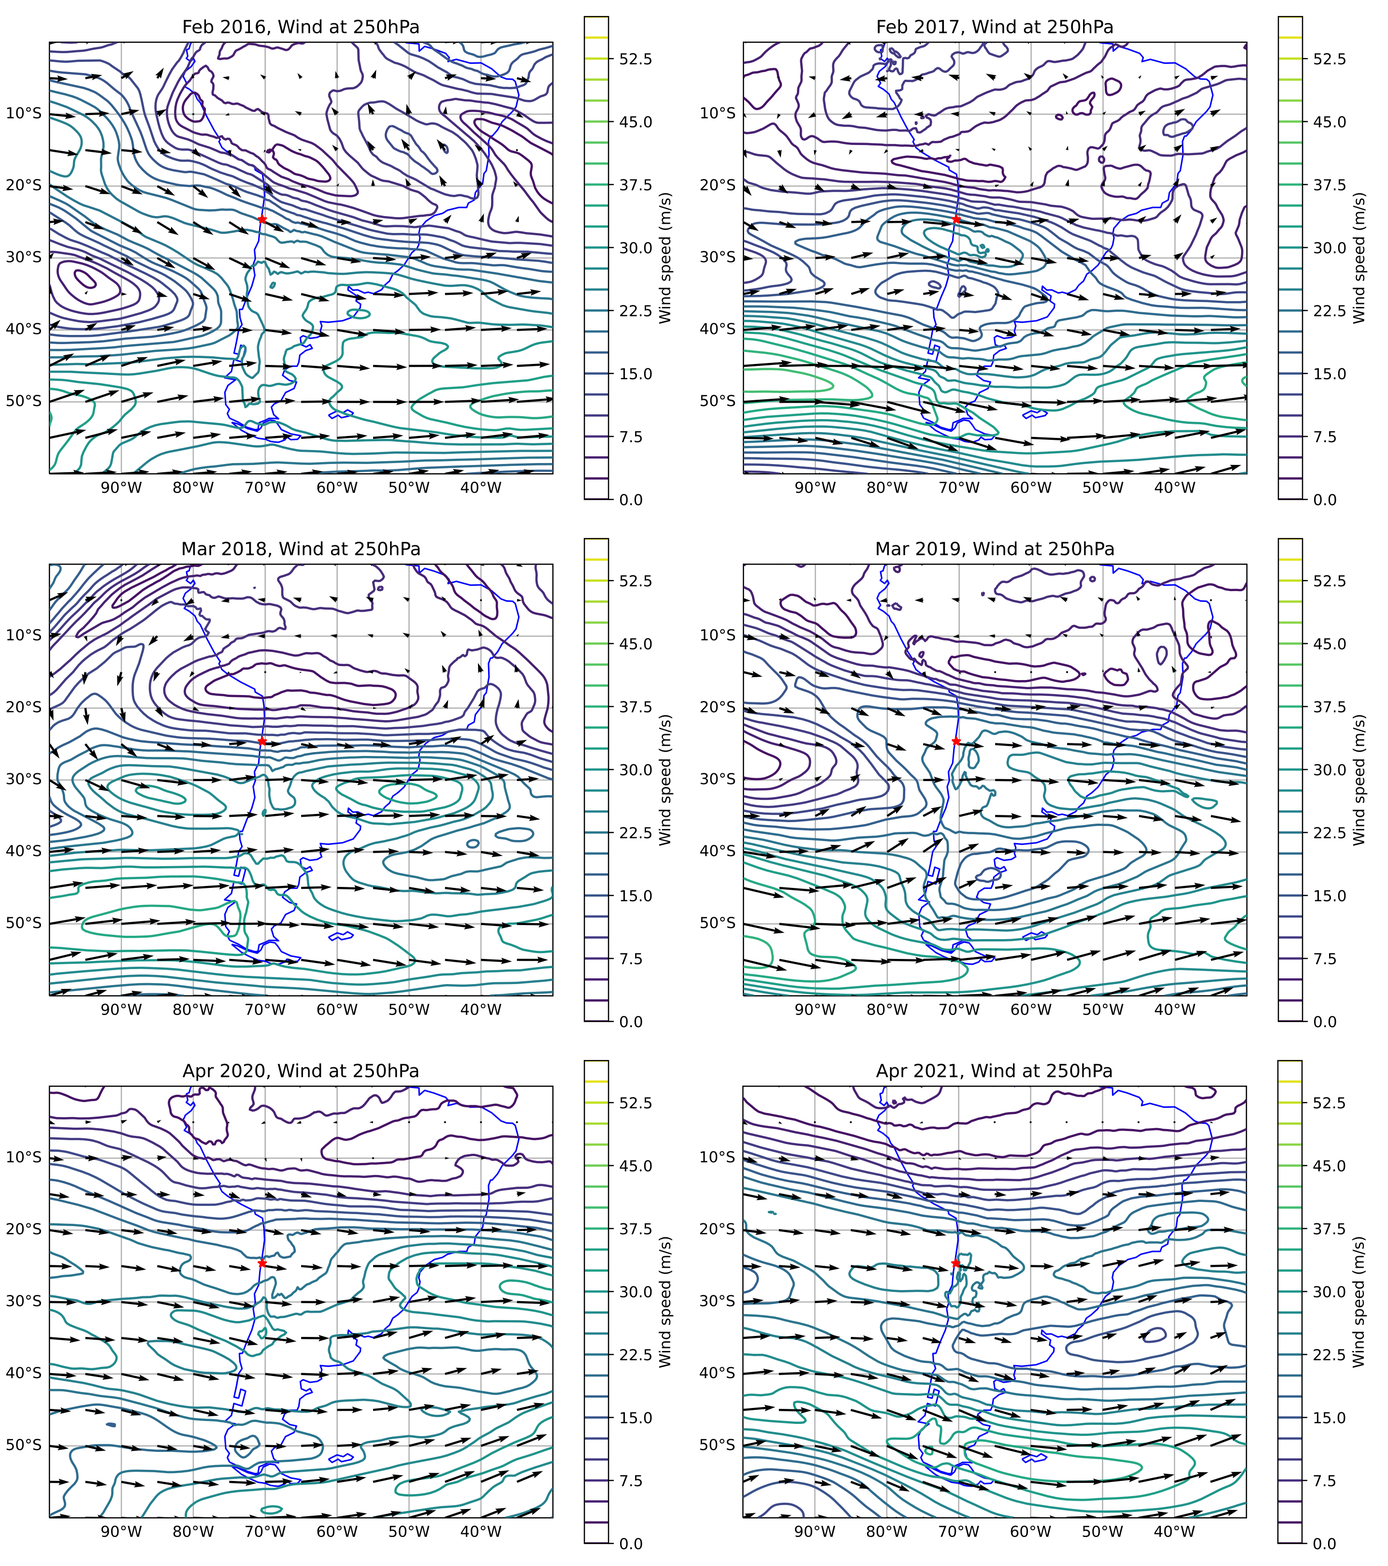
The above animation shows the wind velocity vectors (black arrows) and wind speed contours over South America (blue outline) for the months of January 2016 through to April 2021. The red star indicates the position of Paranal Observatory. These plots are generated from ECMWF data and are used to study high-altitude wind speeds, typically dictated by the position and strength of the jet stream. The differences in wind speed throughout the year have differing effects on long-exposure and short-exposure scintillation.