What if Wayne Gretzky never scored a goal?
Introduction-Methodology-Interesting Seasons-Summary-Appendix
Introduction
What if Wayne Gretzky never scored a goal? We all know the headline stat. If Wayne Gretzky never scored a goal in his career, he’d still have more points (goals plus assists) than any other player in NHL history. The Great One had 1,963 assists (and 894 goals) in his career while the next highest points scorer is Jaromír Jágr with 766 goals and 1,155 assists for a measly 1,921 points. But what difference would a goalless Gretzky have on his season-to-season accolades and how would it affect his teams’ chances of making the playoffs and winning the Stanley Cup?
Methodology
Methodology summary:In this piece, we’ll subtract Gretzky’s goals from every game he played and edit the season standings accordingly. If Gretzky’s goal drought results in a tie, then we simulate overtime. Similarly, if a playoff series is incomplete due to results being flipped from wins to losses, we will simulate entire games. In order to determine the most likely outcomes of each season, we implement “bootstrapping” which allows us to generate a statistically significant sample size of “Goalless Gretzky” seasons.
Methodology detail:Calculating the changes in Gretzky’s statistical accolades is simple, the Art Ross Trophy will be the main focus. It’s also straightforward to determine the changes to Edmonton’s regular season record in the first 4 seasons of Gretzky’s career, since the NHL did not use sudden-death overtime to break ties. Simulating these seasons is simply a case of subtracting Gretzky’s goals from each game, checking the new results and editing each team’s overall records accordingly.
For example, on November 21st 1979, the Edmonton Oilers tied 4-4 with the Toronto Maple Leafs. However, Wayne Gretzky scored 2 goals in this game so we subtract these from Edmonton’s score and now the Maple Leafs have a 4-2 victory. Pretend for a moment that no other results in the 79-80 season were affected by Gretzky’s lack of goals and we’d change Edmonton’s 28-39-13 record (Wins-Losses-Ties) to 28-40-12 while Toronto now have a 36-40-4 record.
In the 1983-84 season, however, the NHL introduced a sudden-death overtime period for the regular season. If, after the 5-minute period, no goals were scored then the game would still end as a tie, it wouldn’t be until 2005 before the NHL introduced the shootout to settle every game. The introduction of overtime poses a problem for our simulations as if, for example, Gretzky scored 2 goals in regular time and his team won by 2, then this game is now a tie after 60 minutes. In this scenario, we will simulate overtime with 4 possible outcomes:
- Tie
- Win for the opposing team
- Win for Gretzky’s team where the game-winning goal (GWG) is scored by a teammate
- Win for Gretzky’s team where the GWG is scored by Wayne Gretzky
We can’t allow this final outcome since our Gretzky can’t score, therefore we will simply re-run the overtime simulation until we achieve an allowable result. The probabilities for each of these outcomes are found by calculating how frequently each scenario occurred in real overtimes played by Wayne Gretzky in his career.
Across his career, the team Gretzky played for competed in 221 regular season overtimes:
- 152 of these ended in ties (68.8%)
- 25 ended in wins for the opposition (11.3%)
- 42 ended in wins for Gretzky’s team with the GWG scored by a teammate (19.0%)
- 2 ended in a win for Gretzky’s team with Gretzky scoring the game-winning goal (0.9%)
These set our probabilities for simulating overtime. Now let’s consider the November 5th 1985 game between the Edmonton Oilers and the Vancouver Canucks. This game finished 6-4 to Edmonton but Gretzky scored two of their goals; therefore, this game has now finished 4-4 after 60 minutes. We simulate overtime by generating a random number between 0 and 1000 and comparing this to a series of thresholds set by the probabilities above. Call this random number N, then the final result is determined as follows:
- 0<≤N≤688 → Tie (i.e. there’s a 688/1000 = 68.8% chance of a tie)
- 688<N≤801 → Win for Vancouver (i.e. there’s a (801-688)/1000 = 113/1000 = 11.3% chance of a Vancouver win)
- 801<N≤991 → Win for Edmonton
- 991<N≤1000 → Simulate OT again as Gretzky “scored”
Similarly, if the goalless Gretzky leads his team to the playoffs, then we have to apply a similar idea to resolve any games finishing as ties after 60 minutes. The differences here are that: we no longer allow a Tie to occur; and we use probabilities based on playoff games decided by overtime that Gretzky played in (Win-Loss-Gretzky GWG = 16-18-4).
In addition to simulating overtimes, if we flip a Win into a Loss due to Gretzky’s goal drought in a playoff series that was ultimately won by Wayne’s team, we now have to simulate entire games to finish the series off. The idea for this is the same as simulating overtime and is best explained with the following example:
In 1984, the Edmonton Oilers swept the Minnesota North Stars in the best-of-seven Clarence Campbell Conference Final. The Oilers won Game One 7-1, Gretzky had only 1 goal so this remains a win for Edmonton. In Game Two, the Oilers won 4-3 but if we remove the game-winning goal that Gretzky scored then this is a 3-3 tie and we have to simulate overtime. Let’s assume that the overtime simulation produced a win for Minnesota, so now the series is tied at 1-1. Games 3 and 4 still go the way of Edmonton and they have a 3-1 lead over Minnesota but now we’re left with an incomplete series and no more real games to manipulate. Therefore we calculate the probability that Edmonton will win the next game by taking their win percentage in the series so far, 3 wins out of 4 for a 75% win percentage. Once again we generate a random number, N, between 0 and 1000 and determine the outcome as follows:
- 0<≤N≤750 → Win for Edmonton
- 750<N≤1000 → Win for Minnesota
Let’s imagine that luck isn’t in Edmonton’s favour, the random number is greater than 750 and so the North Stars win Game 5. Now we must simulate Game 6 with a newly-generated Edmonton win percentage: 3 wins out of 5 for a 66.7% win percentage. We’ll end the example here by imagining the random number generated is less than 667 and so the Edmonton Oilers win the series 4-2 and advance to the Stanley Cup Final.
Now given that we are simulating seasons with an element of random chance, we can’t just simulate a season once and take the results from that simulation. Otherwise, we could have a statistically unlikely season where, despite Gretzky’s lack of goals, the Oilers might still win every overtime and every playoff game that has to be randomly decided. In order to counter this, we’ll employ a technique called “bootstrapping” where we’ll simulate each season 1000 times and find the average outcome of all those simulations.
Interesting Seasons (back to top)
79-80 80-81 81-82 82-83 83-84 84-85 85-86 86-87 87-88 88-89 89-90 90-91 91-92 92-93 93-94 94-95 95-96 96-97 97-98 98-99
Summary
The links above can be used to skip to a given season or the summary. The most interesting seasons that are included in the main text below are highlighted.
1982-83 season (back to list of seasons)
Real season: The Oilers topped the Smythe Division with a 47-21-12 record and made it all the way to the Stanley Cup Final where they were swept by the Islanders. Gretzky won his 3rd consecutive Art Ross by 72 points over Peter Stastny.
Goalless Gretzky: The Oilers retain their position atop the Smythe, finishing with a 42-29-9 record and making the playoffs. In 163 of our simulations, the Winnipeg Jets got the better of the Oilers in the Division Semifinals. This is due to Gretzky’s four-goal Game One being flipped to a 3-2 win for the Jets, allowing the series to go to a Game Four and potentially Game Five which if won by the Jets means they take the series. In the other 837 simulations, the Oilers have no trouble reaching the Stanley Cup Final. Despite another 4-goal performance for Gretzky against Calgary in Game 3 of the Division Finals, this remains a 6-2 victory for Edmonton instead of the 10-2 blowout it was in real life. Similarly against the Chicago Blackhawks, Gretzky posted 10 assists in 4 games so even without scoring the Oilers progress easily. In the Stanley Cup Final Gretzky went goalless in real life and of course does the same here, but this is the closest our goalless Gretzky has got to lifting Lord Stanley’s Mug so far. Playoffs: 12 goals lost, dropping Gretzky to 5th in the playoff points leaders.
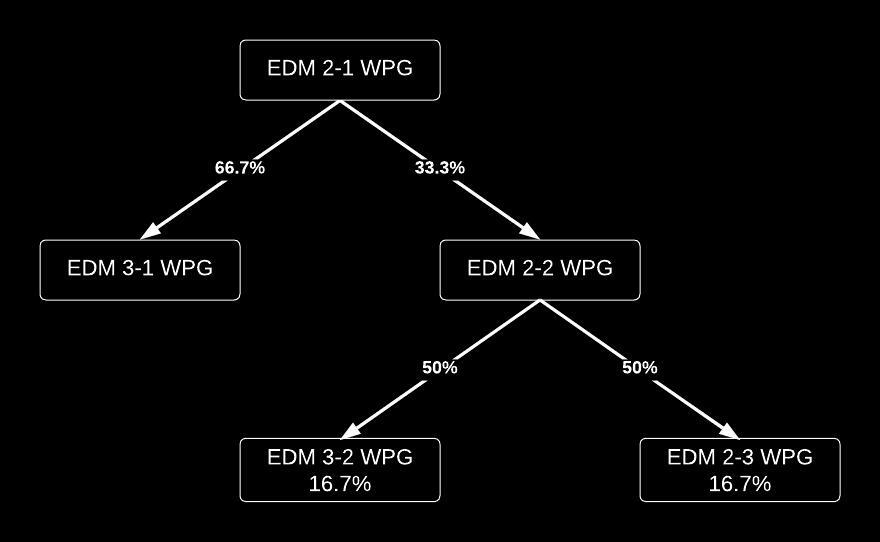
I’ll use this opportunity to illustrate the power of the bootstrap method. As we saw, 163 out of 1000 simulations ended with the Jets beating the Oilers in the Smythe Division Semifinals. We can calculate the likelihood of the outcomes by using a probability tree which is shown below. The point at which the randomness of the simulation starts to matter is when we reach Game Four of the series, which was never played in real life so we have to simulate it. The series is incomplete with Edmonton having a 2-1 lead. We assign the probability that Edmonton win Game Four based on the previous three results in the series. As they have won 2 out of the 3 games, we let there be a 66.7% chance that they win the game and therefore win the series 3-1. This is shown by the left branch on the tree. Conversely, there’s a 33.3% chance that Winnipeg even up the series at 2-2, which is the first step that must occur if the Jets are to win the series. For Game Five, we calculate the new probabilities that either team wins, which is 50% for both because each team has won 2 out of the 4 games in the series. Therefore, the probability that Winnipeg win the series is given by the probability they win Game Four multiplied by the probability they win Game Five, i.e. 0.333*0.5 = 16.7%. Or to put it another way, for 1000 simulations, we’d expect 167 of these to go the way of Winnipeg, which is very close to the 163 Winnipeg wins that we found using the bootstrap method. By employing the bootstrap method and simulating the season many times, we’ve created a large enough sample size that we’re close to the actual probability for this simple scenario. In more complicated cases, such as later seasons where every tied game has an element of randomness and playoff runs could have multiple series that go to random chance, calculating these probability trees would become unwieldy. Thus, the bootstrap method becomes very useful as we can be confident that the percentage of seasons with a given outcome is an accurate measure of the genuine probability.
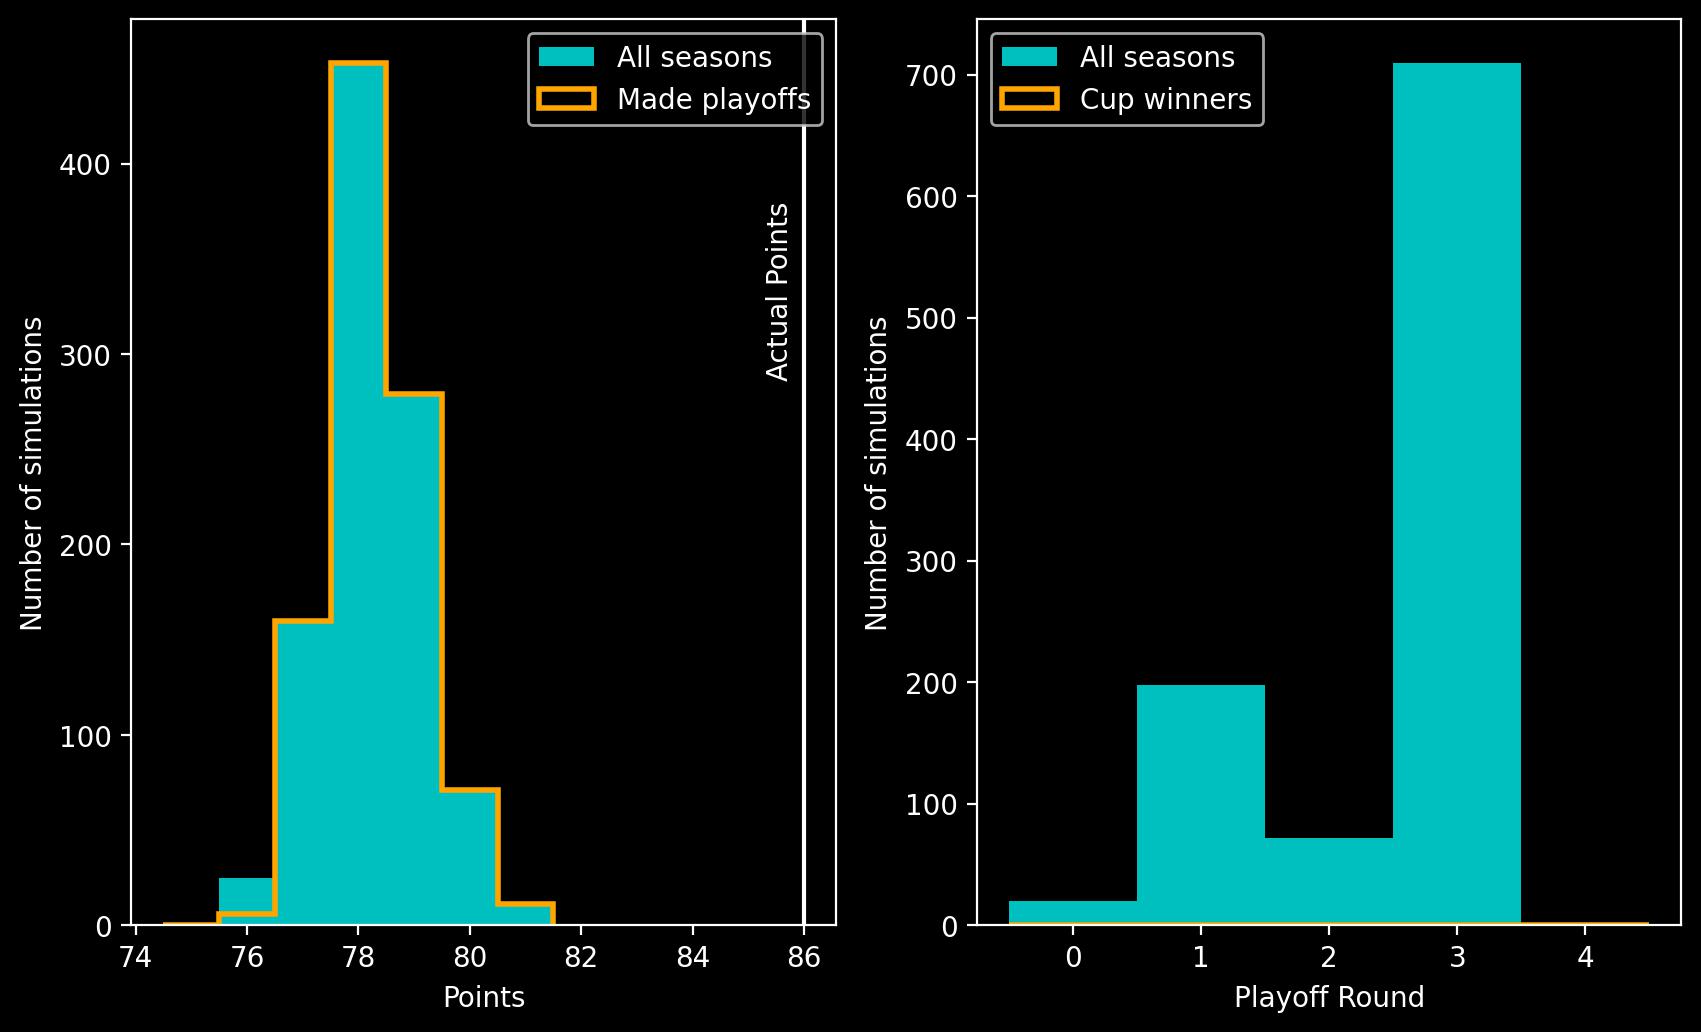
As noted above, Gretzky won the Art Ross Trophy by 72 points over Peter Stastny in the real world. He had 125 assists on the season and… 71 goals, which means our goalless Gretzky has won his first Art Ross without ever lighting the lamp!
1983-84 season (back to list of seasons)
Real season: This is where things start to get more interesting as the NHL introduced a 5-minute overtime period in the regular season. We’ll have to simulate this if the Oilers tie as a result of Gretzky’s goal drought. This will also be an interesting test of the simulations as this is the first year Gretzky won the Stanley Cup! The Oilers posted a 57-18-5 record to top the Smythe with 119 points before sweeping the Division Semifinals against the Jets, winning a Game 7 decider against the Flames, sweeping the Minnesota North Stars in the Conference Finals and beating the Islanders 4-1 to lift the cup. Gretzky won the Art Ross with 205 points to his teammate Paul Coffey’s 126.
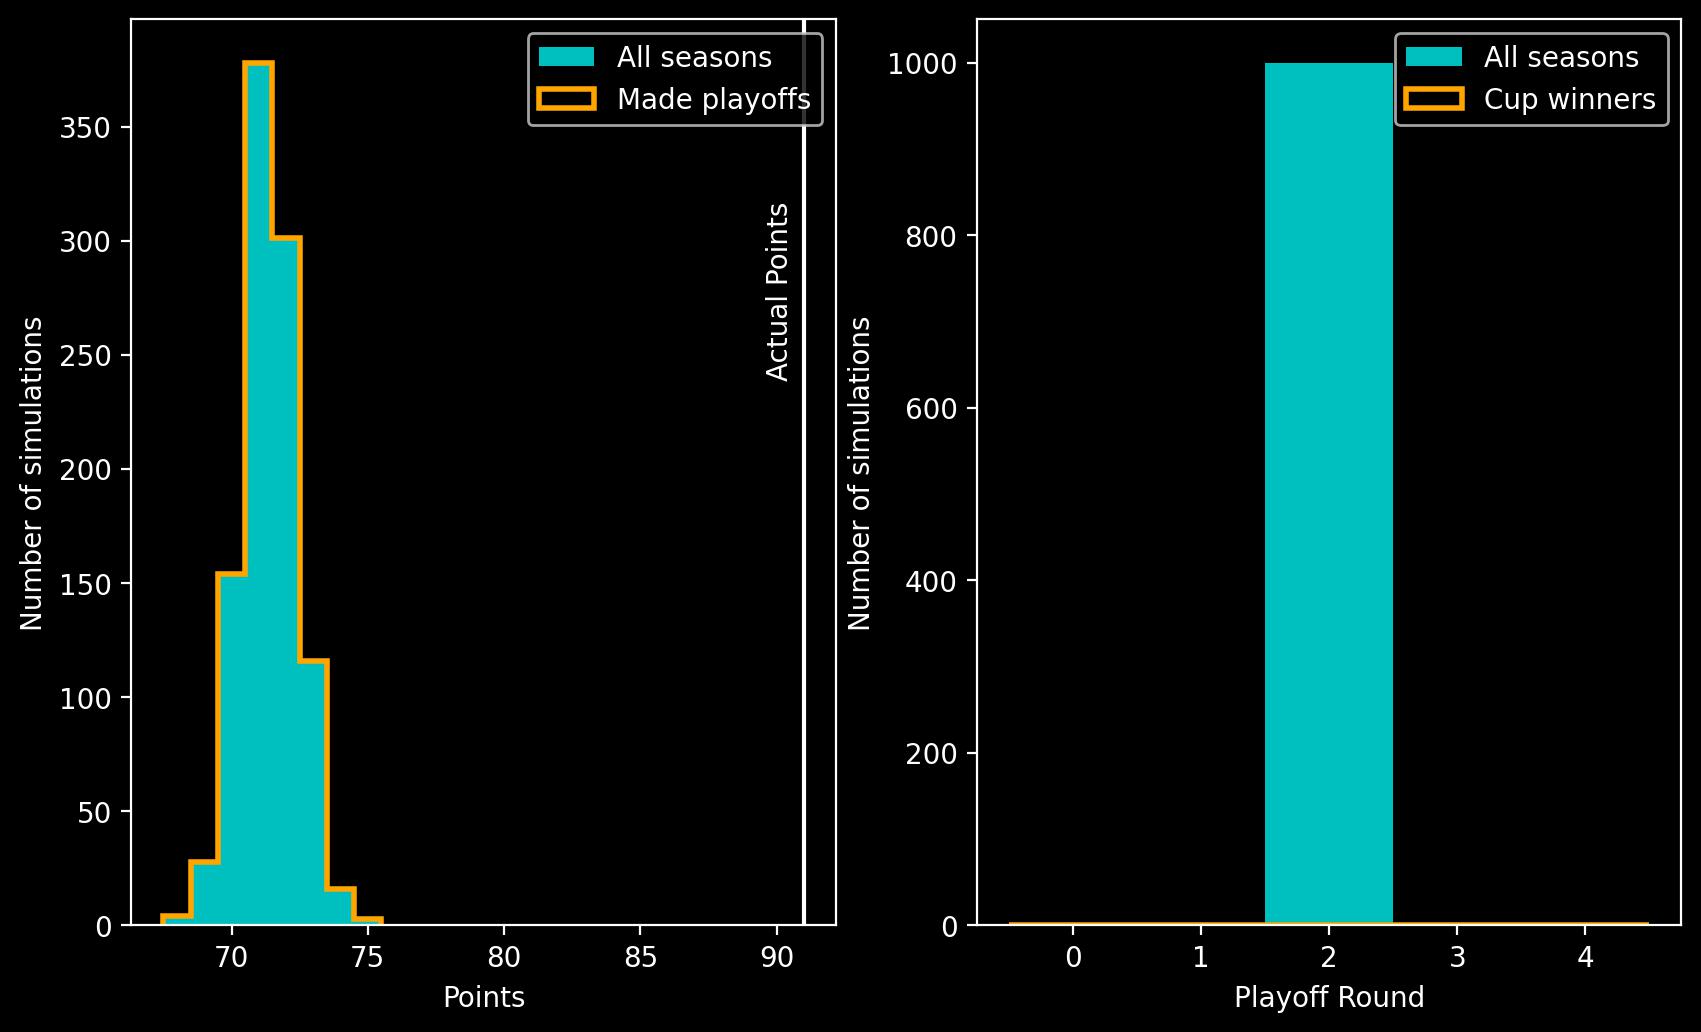
Goalless Gretzky: It’s time for some graphs! The histograms on the left show the points total of Gretzky’s team in each of the 1000 simulations and whether they made the playoffs (as an orange outline). On the right, this shows which round of the playoffs Gretzky’s team reached before elimination, with the orange outline showing in how many simulations they won the Stanley Cup. From now on, when I say “average,” I’ll be quoting the median regular season points total for Gretzky’s team. In our simulations, the Oilers averaged 90 points which drops them from 1st to 9th in the overall NHL standings but they still remain atop the Smythe and comfortably make the playoffs in every simulation. For the sake of more accurate simulations, we’ll imagine that the Oilers’ playoff opponents are the same in the simulations as they were in reality, since we can continue manipulating real game results rather than simulating an entire postseason.
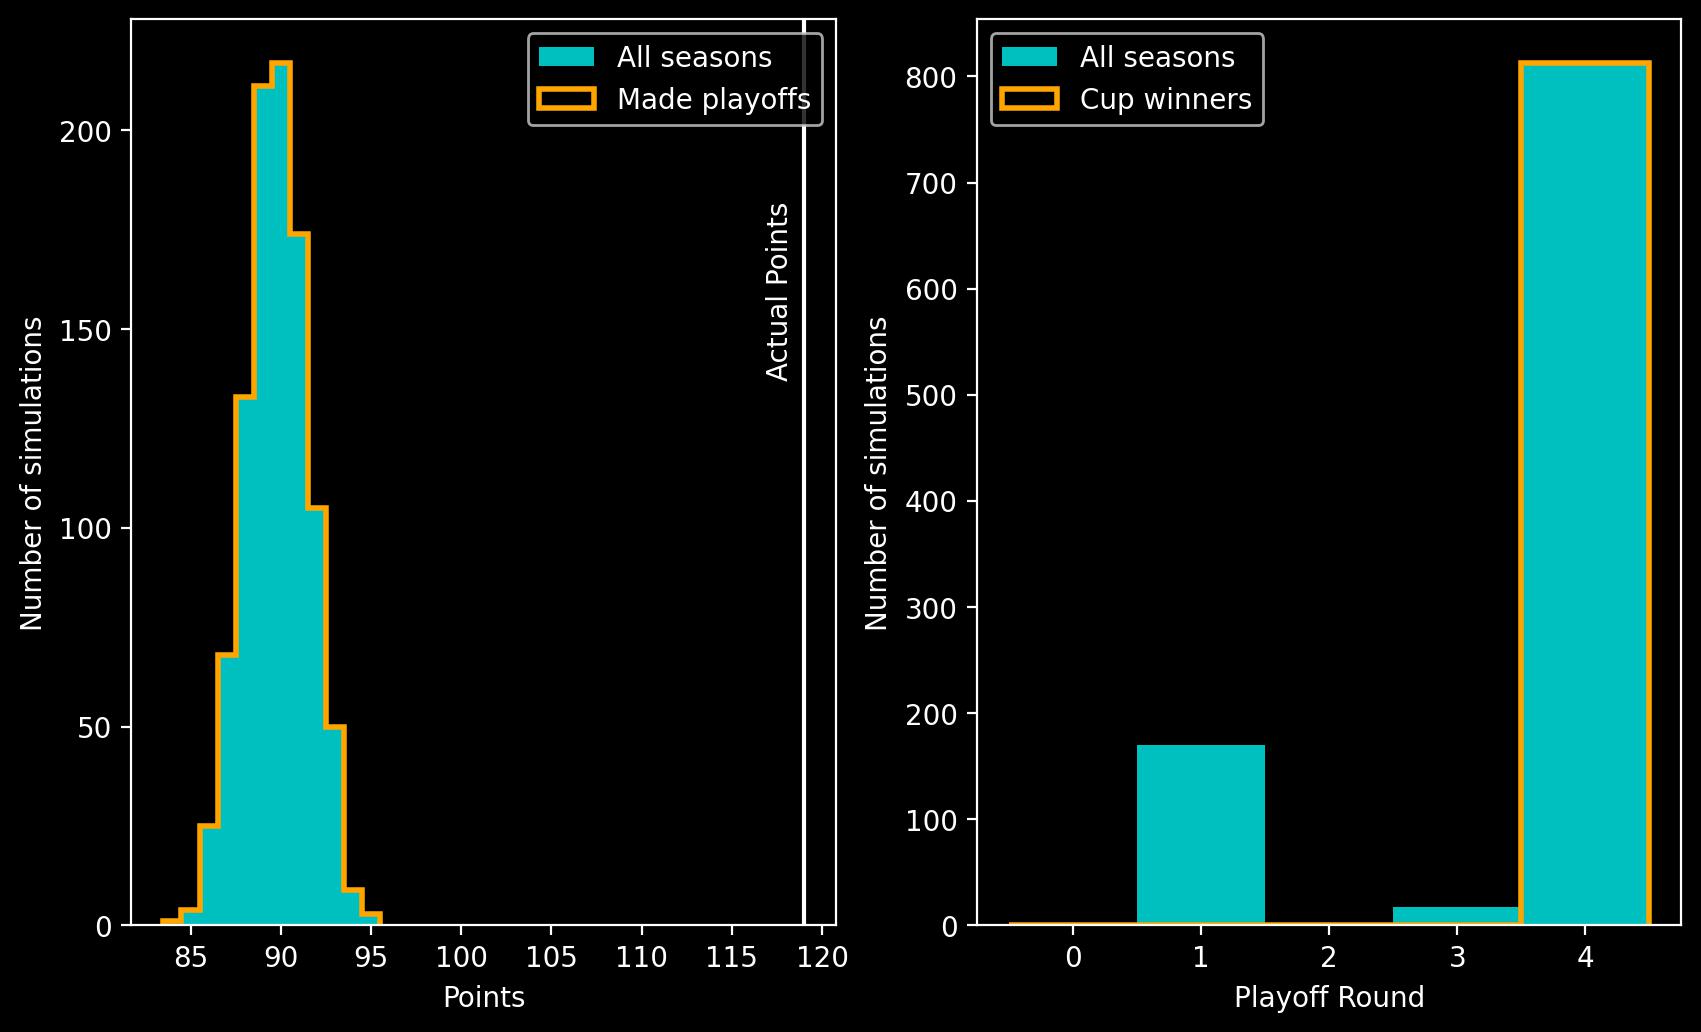
In the playoffs, the Oilers are knocked out by the Jets again, this time in 170 of the simulations. This is due to Game Two being flipped from a 5-4 OT win to a 4-3 loss since Gretzky’s missing goal means the game never makes it to overtime. They have no trouble against the Calgary Flames in Round 2 but in 17 of the simulations they lose to the Minnesota North Stars in the Conference Finals. In the remaining 813 simulations where Edmonton reached the Stanley Cup Final, they are guaranteed to win the Stanley Cup!
In the Points Leader standings:
| Rank (Previous) | Player | Goals | Assists | Points |
|---|---|---|---|---|
| 1 (3) | Michel Goulet | 56 | 66 | 122 |
| 2 (4) | Peter Stastny | 46 | 73 | 119 |
| 3 (5) | Mike Bossy | 51 | 67 | 118 |
| 4 (6) | Barry Pederson | 39 | 77 | 116 |
| 5 (1) | Wayne Gretzky | 0 (87) | 116 (118) | 116 (205) |
| … | … | … | … | … |
| 10 (2) | Paul Coffey | 39 (40) | 58 (86) | 97 (126) |
Michel Goulet wins the Art Ross by 3 points over his Quebec Nordiques teammate Stastny while Wayne Gretzky drops to 5th place. An extra complication in calculating Gretzky’s assist total occurs. Gretzky missing goals means that two games (1983-10-09 against MNS and 1984-03-13 against QUE) no longer go to overtime so Gretzky loses his assists on the game-winning goals. Paul Coffey drops all the way to 10th place as he loses 28 of his assists on Gretzky goals, as well as the OT winner against Quebec (not as bad as Jari Kurri’s loss of 38 assists and a goal this season though!).
Jari Kurri leads the playoff points standings with 23 points (14 goals, 9 assists). Gretzky drops to 2nd place with 22 points. Mark Messier finishes with 8 goals, 13 assists for 21 points while Paul Coffey has 8 goals and 10 assists for 18 points.
1984-85 season (back to list of seasons)
Real season: The Edmonton Oilers go 49-20-11 for 109 points, they top the Smythe and once again win the Stanley Cup. Wayne wins the Art Ross with 208 points to Jari Kurri’s 135.
Goalless Gretzky: The average simulation has a final total of 88 points for the Oilers. They drop to 3rd or 4th in the Smythe but are always comfortably above the 5th-placed Canucks who finished with only 59 points in the real season, meaning that the Oilers still make the playoffs every time.
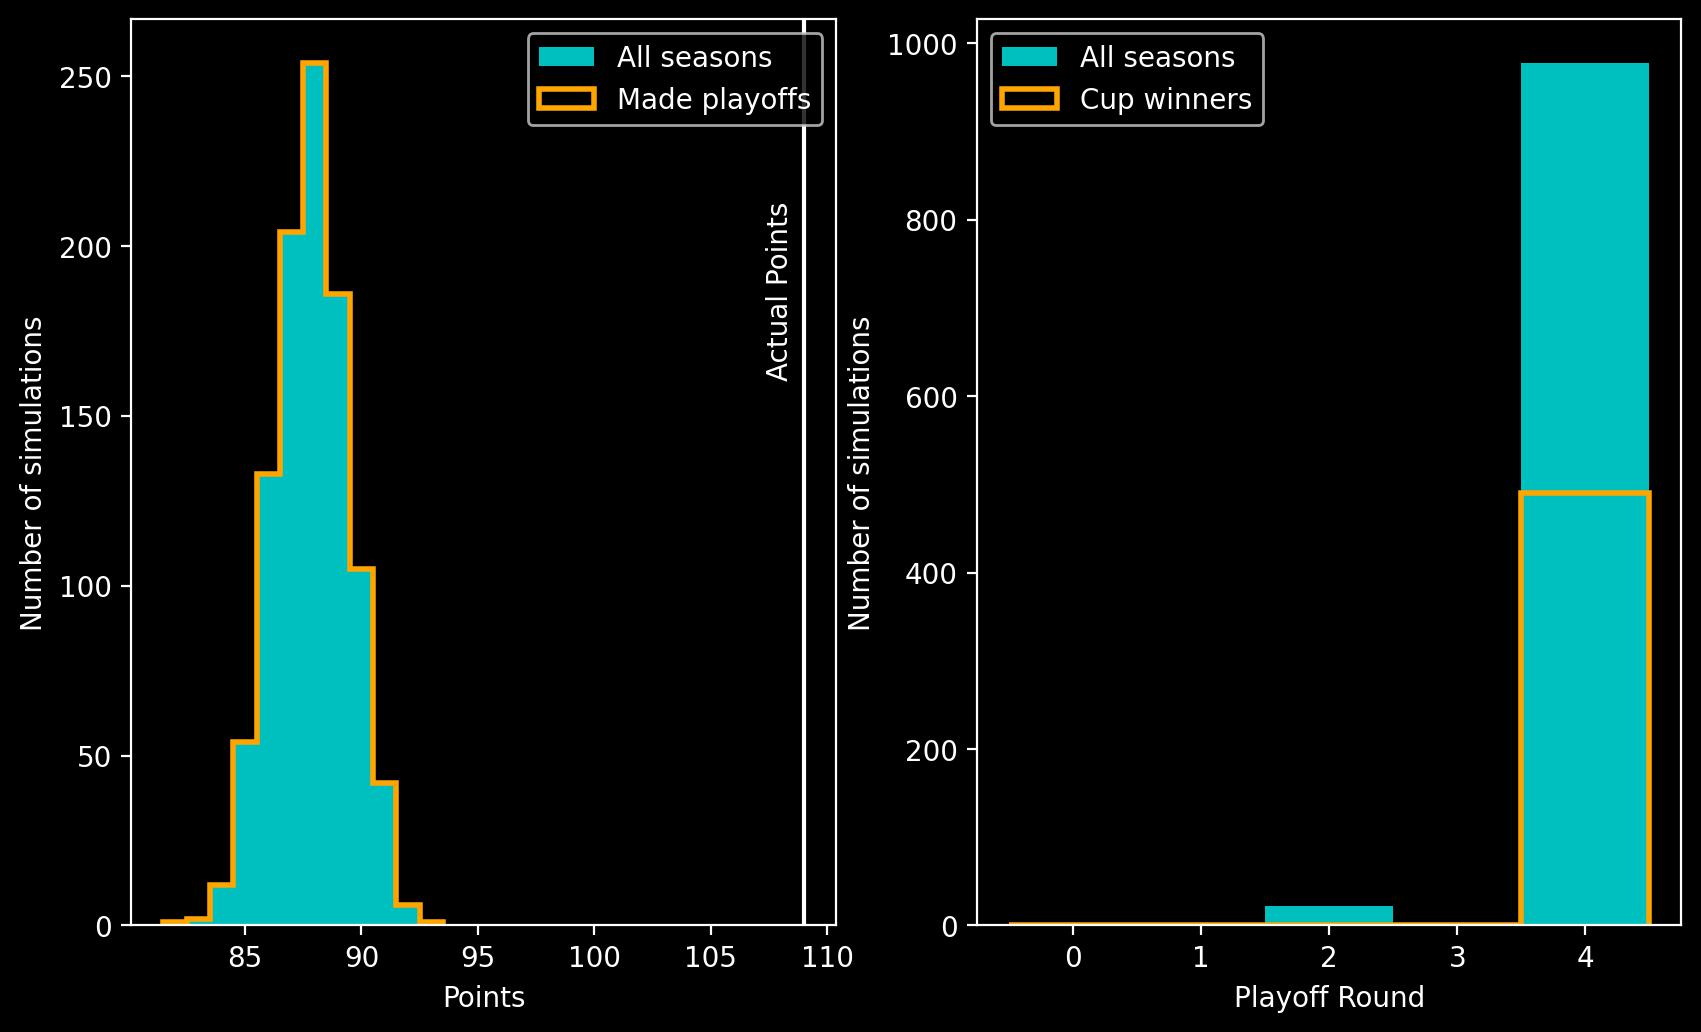
The Oilers sweep the Kings in the Division Semis but once again face a tougher test against the Jets. In 22 of our simulations, Winnipeg beat the Oilers. If Edmonton get past the Jets they beat Chicago in every simulation to set up the Stanley Cup Final against the Flyers. The finals play out as follows:
- Game One: PHI win 4-1
- Game Two: EDM win 2-1 despite Gretzky having a goal wiped off
- Game Three: PHI win 3-1 as Gretzky's hat-trick is erased
- Game Four: 3-3 after regulation so we simulate overtime
- Game Five: EDM win 7-3 despite Gretzky having a goal wiped off
After the 5 games we can manipulate, either team could hold a 3-2 lead depending on the outcome of Game Four and we continue simulating the extra games. In the 978 simulations where the Oilers made the finals, they won the cup in 490 of the outcomes. We’ll count this as half a win for Gretzky in the final stats rundown.
Gretzky wins his second Art Ross with 135 points to Dale Hawerchuk’s 130. Jari Kurri’s 135 points total is reduced to 102 after losing 33 assists on Gretzky goals. Playoffs: Gretzky loses 17 goals but still remains the highest points scorer in the playoffs as Coffey and Kurri lose their assists on Gretzky’s goals.
1985-86 season (back to list of seasons)
Real season: The Edmonton Oilers win the inaugural Presidents’ Trophy with 119 points then sweep the Canucks in the Division Semi-Finals before losing in Game Seven to the Flames after Steve Smith banked the puck off his own goaltender. Gretzky wins the Art Ross with his highest career total of 215 points to Mario Lemieux’s 141.
Goalless Gretzky: The Oilers average 105 points meaning that they don’t hold onto the Presidents’ Trophy. Nonetheless, the Oilers make the playoffs in every simulation. Just like real life, Edmonton sweep the Canucks but are beaten by the Flames in the Division Finals.
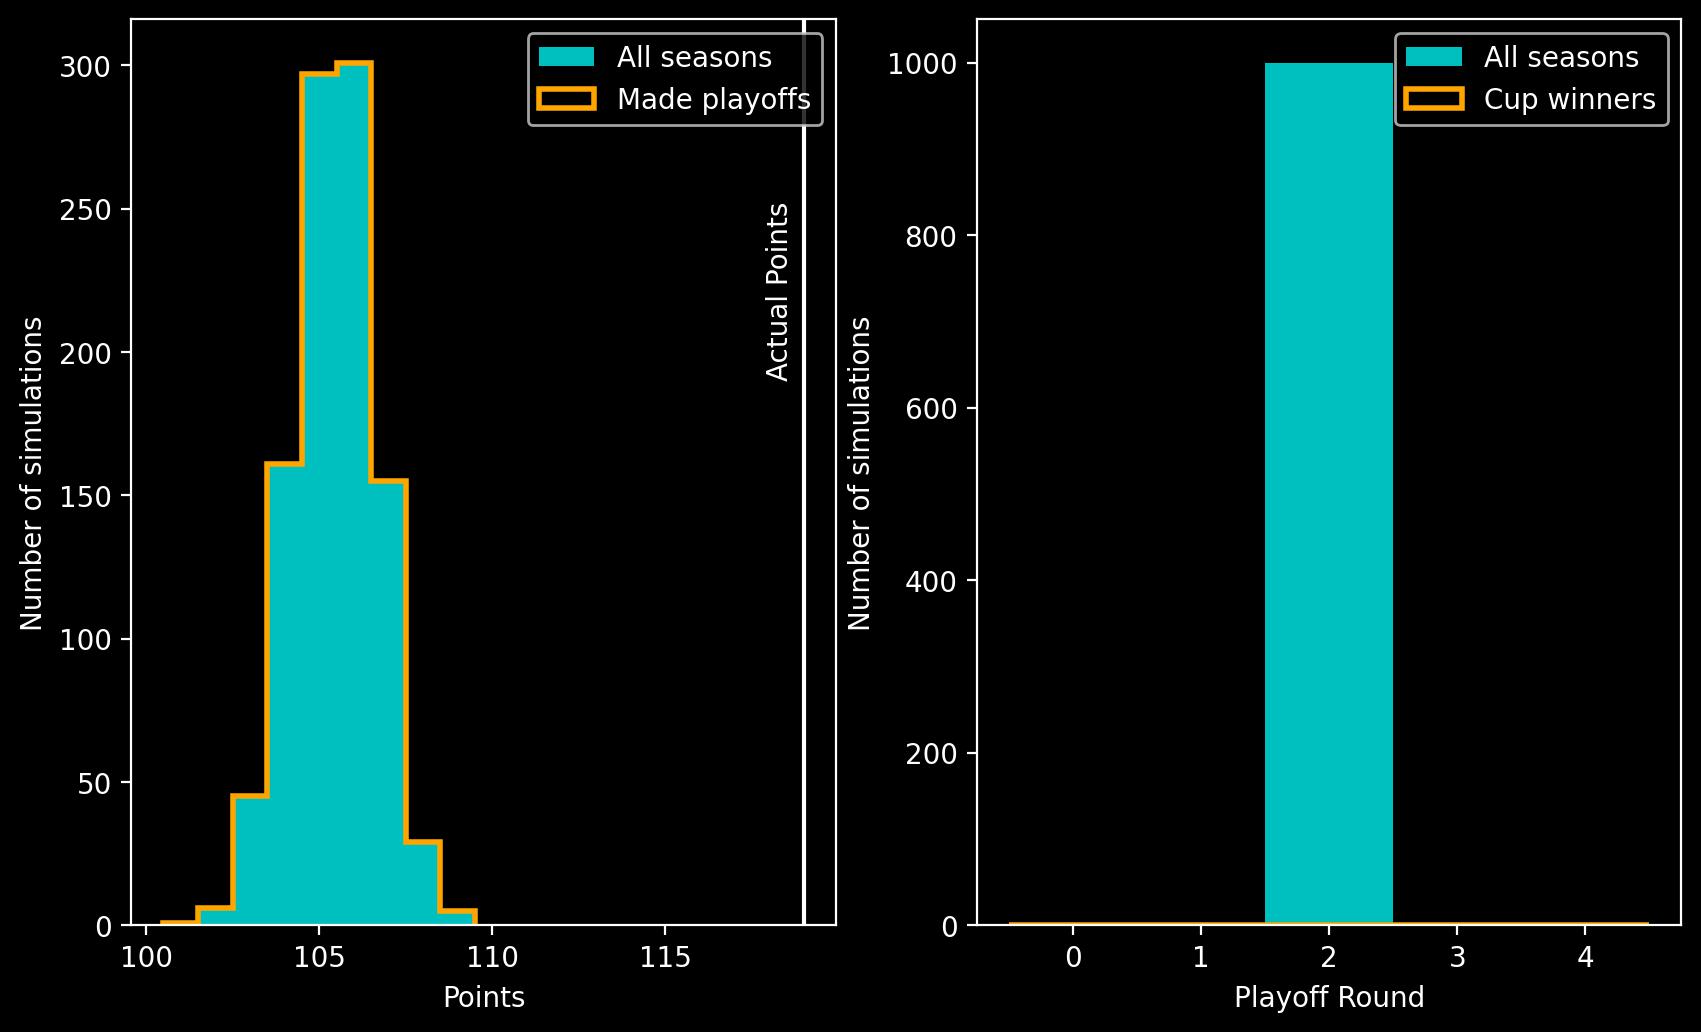
Gretzky’s 163 assists mean that even without scoring, he comfortably wins the Art Ross by 22 points over Lemieux. Since 1947 when the trophy was first awarded, there are only 3 seasons (ignoring Gretzky seasons) where the Art Ross Trophy winner had a lead over 2nd place that was greater than 22 points: Gordie Howe (95) vs Ted Lindsay (71) in 1953; Phil Esposito (130) vs Bobby Clarke (104) in 1973; Phil Esposito (145) vs Bobby Orr (122) in 1974. We’ll also see a couple seasons for Mario Lemieux that beat this mark once we remove Gretzky’s goals. Playoffs: 8 goals lost. Gretzky falls from 3rd to around 30th in the playoffs points standings.
1986-87 season (back to list of seasons)
Real season: The Edmonton Oilers win another Presidents’ Trophy with 106 points and go all the way in the playoffs, winning another Stanley Cup. The Great One wins another Art Ross with 183 points ahead of a tight race for 2nd between Jari Kurri, Mario Lemieux and Mark Messier who finish with 108, 107 and 107 points respectively.
Goalless Gretzky: The Oilers average 88 points and lose their grip on the Smythe Division but still make the playoffs in every scenario. Gretzky had a quiet playoff run for goals in the real 1987 and this is reflected as the Oilers make the Stanley Cup Finals in every simulation. Once again they face the Philadelphia Flyers but Gretzky’s missing goal in Game Two flips this from a 3-2 OT Edmonton win to a 2-1 Flyers win and Philadelphia win the Cup in 6 games.
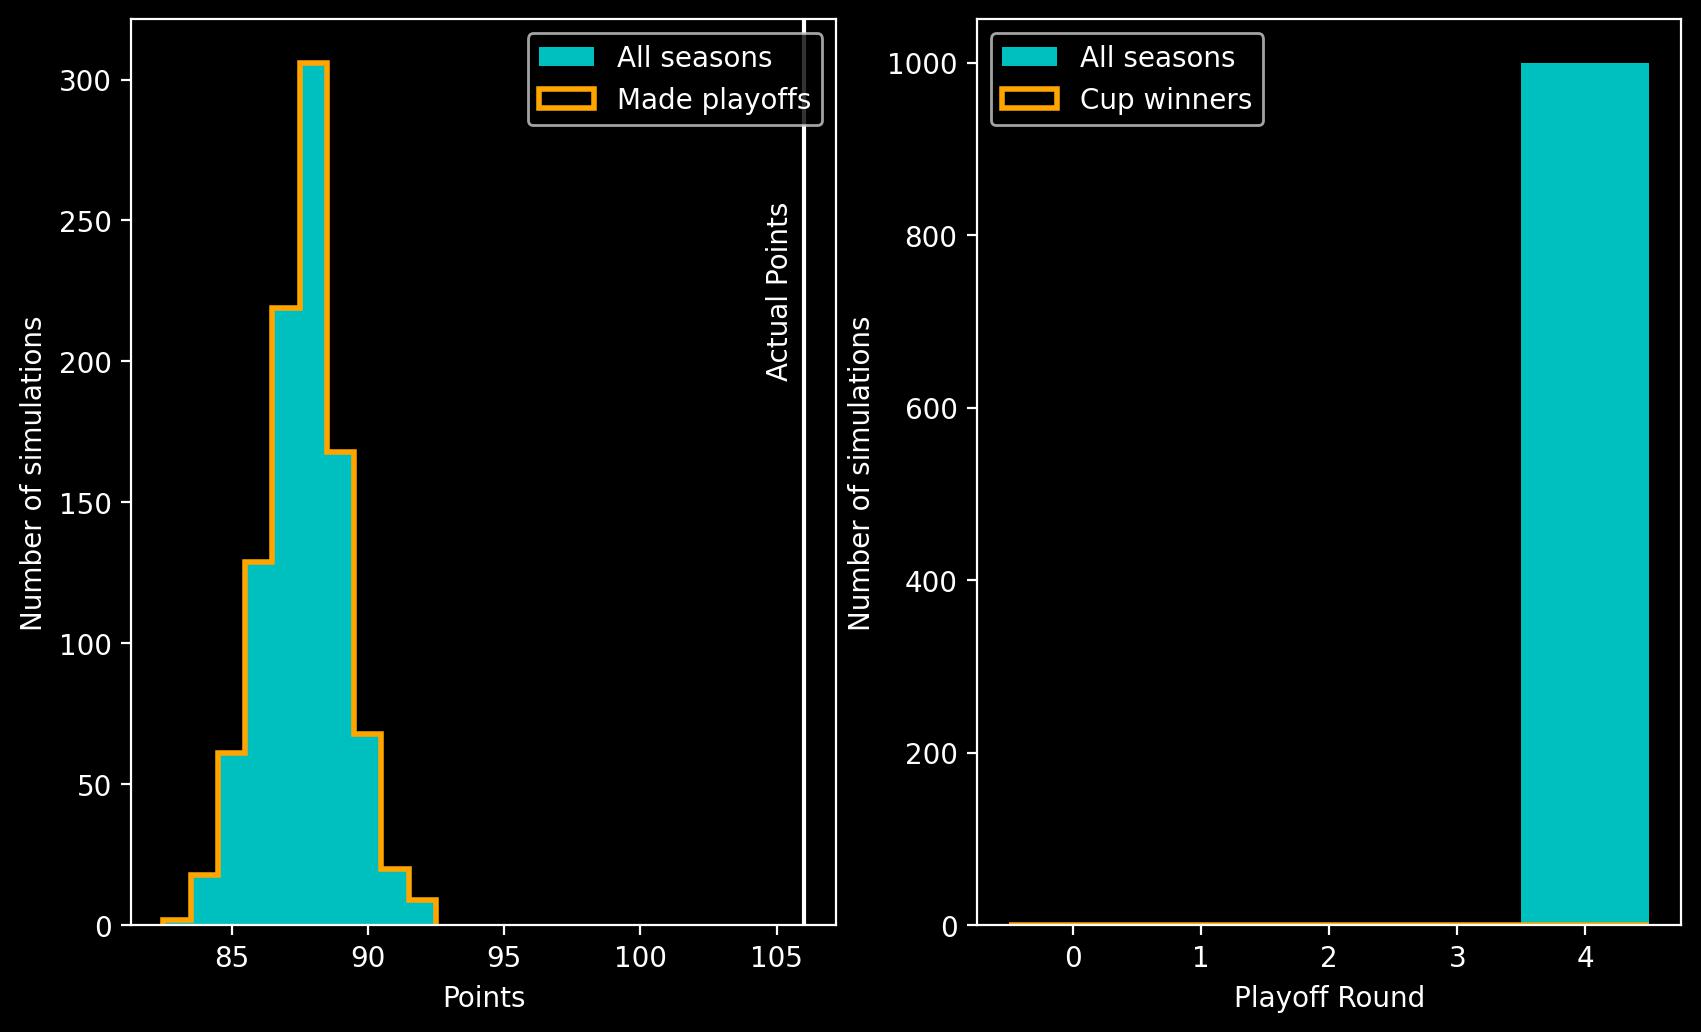
Gretzky’s 119 assists (reduced from 121) win him his 4th Art Ross with Mario Lemieux being his next closest rival on 107. Jari Kurri and Mark Messier lose goals and assists so drop further down the list.
Playoffs: Gretzky loses 5 goals from the playoff run. He also loses an assist on Jari Kurri’s game winner in Game Two of the finals and his assist in the Game Seven that never occurs. This has the following affect on the playoff points leaders:
| Rank (Previous) | Player | Goals | Assists | Points |
|---|---|---|---|---|
| 1 (3) | Brian Propp | 12 | 16 | 28 |
| 2 (2) | Mark Messier | 11 (12) | 16 | 27 (28) |
| 3 (1) | Wayne Gretzky | 0 (5) | 27 (29) | 27 (34) |
| 4 (5) | Pelle Eklund | 7 | 19 (20) | 26 (27) |
| 5 (4) | Glenn Anderson | 13 (14) | 12 (13) | 25 (27) |
1987-88 season (back to list of seasons)
Real season: Wayne Gretzky missed 20% of the season through injury but the Oilers managed 99 points to finish 2nd in the Smythe Division. They then cruised to the Stanley Cup losing only 2 games during the playoffs. Gretzky only managed 64 games and promptly lost the Art Ross to a 22-year-old Mario Lemieux.
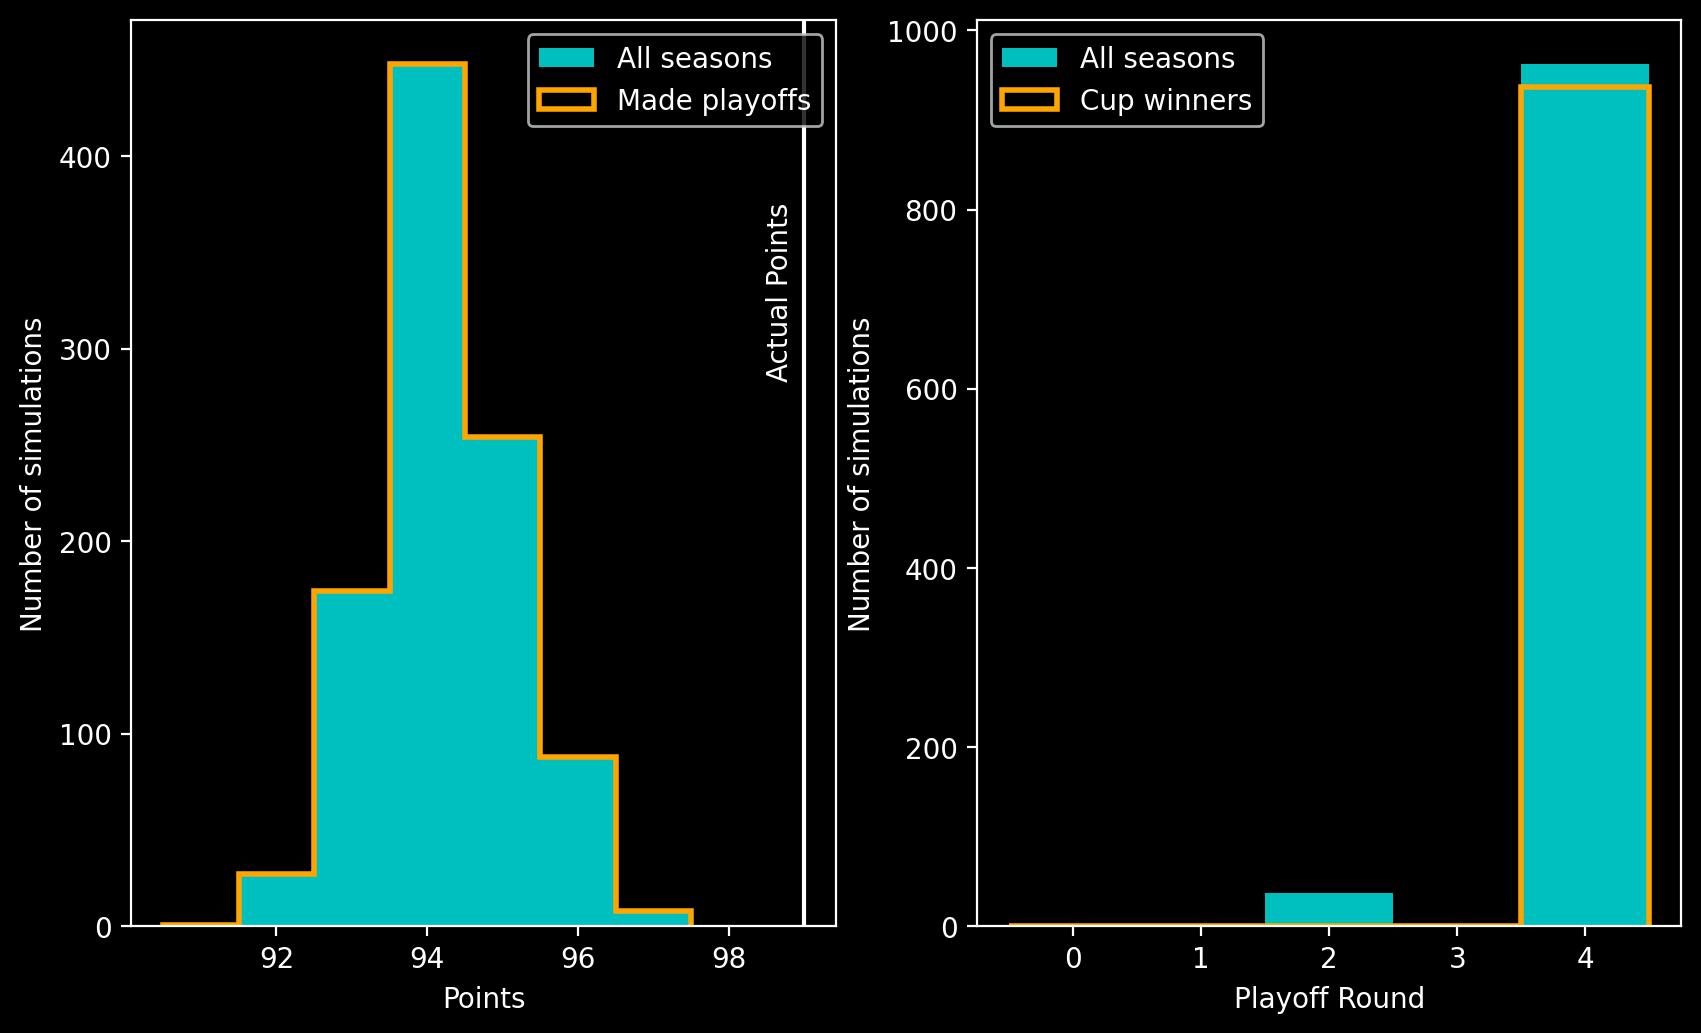
Goalless Gretzky: The Oilers average 94 points, maintaining their 2nd place in the division. They make the playoffs in every simulation but have a slightly tougher time in the Division Finals against the Flames. Calgary take Game Two 4-3 in the Battle of Alberta as Gretzky’s regular time marker doesn’t count so he doesn’t have the chance to score the short-handed overtime winner that occurred in the real game. This allows the series to go to simulated games 5, 6 and 7 which lets the Flames advance in Edmonton’s place in 37 of our simulations. The Oilers win the Stanley Cup in 937 of the 963 simulations where they make the finals. Game One ends in a 1-1 tie so we have to simulate overtime which gives the Boston Bruins the opportunity to reverse the result and win the cup in 26 of our simulations. Mario Lemieux wins the Art Ross by the extended margin of 37 points over Denis Savard as Gretzky falls away to 6th spot. Playoffs: 12 goals lost. Messier loses 3 assists so he and Gretzky tie with 31 points but Messier’s 11 goals mean he leads the playoff points standings.
We now skip ahead 10 years to Gretzky’s final two seasons. In the interim, Gretzky was traded to the Los Angeles Kings in “The Trade” and played 7½ seasons with them before being traded to the St. Louis Blues until the end of the 1995-96 season. He then signed with the New York Rangers in 1997 and played out his final three seasons with them.
1997-98 season (back to list of seasons)
Real season: The Rangers finished 11th in the Eastern Conference, missing the playoffs, with 68 points. Gretzky finished 4th in scoring behind Jágr, Forsberg and Bure. Gretzky entered the season with 1843 assists, needing 7 more to match Gordie Howe’s points record. On October 26th 1997 against the Mighty Ducks of Anaheim, Gretzky matched Mr Hockey with the secondary assist on Niklas Sundström’s go-ahead goal. Then, 32 seconds into the 3rd period, The Great One assisted Ulf Samuelsson’s goal to pull ahead of Gordie Howe’s points total with only assists.
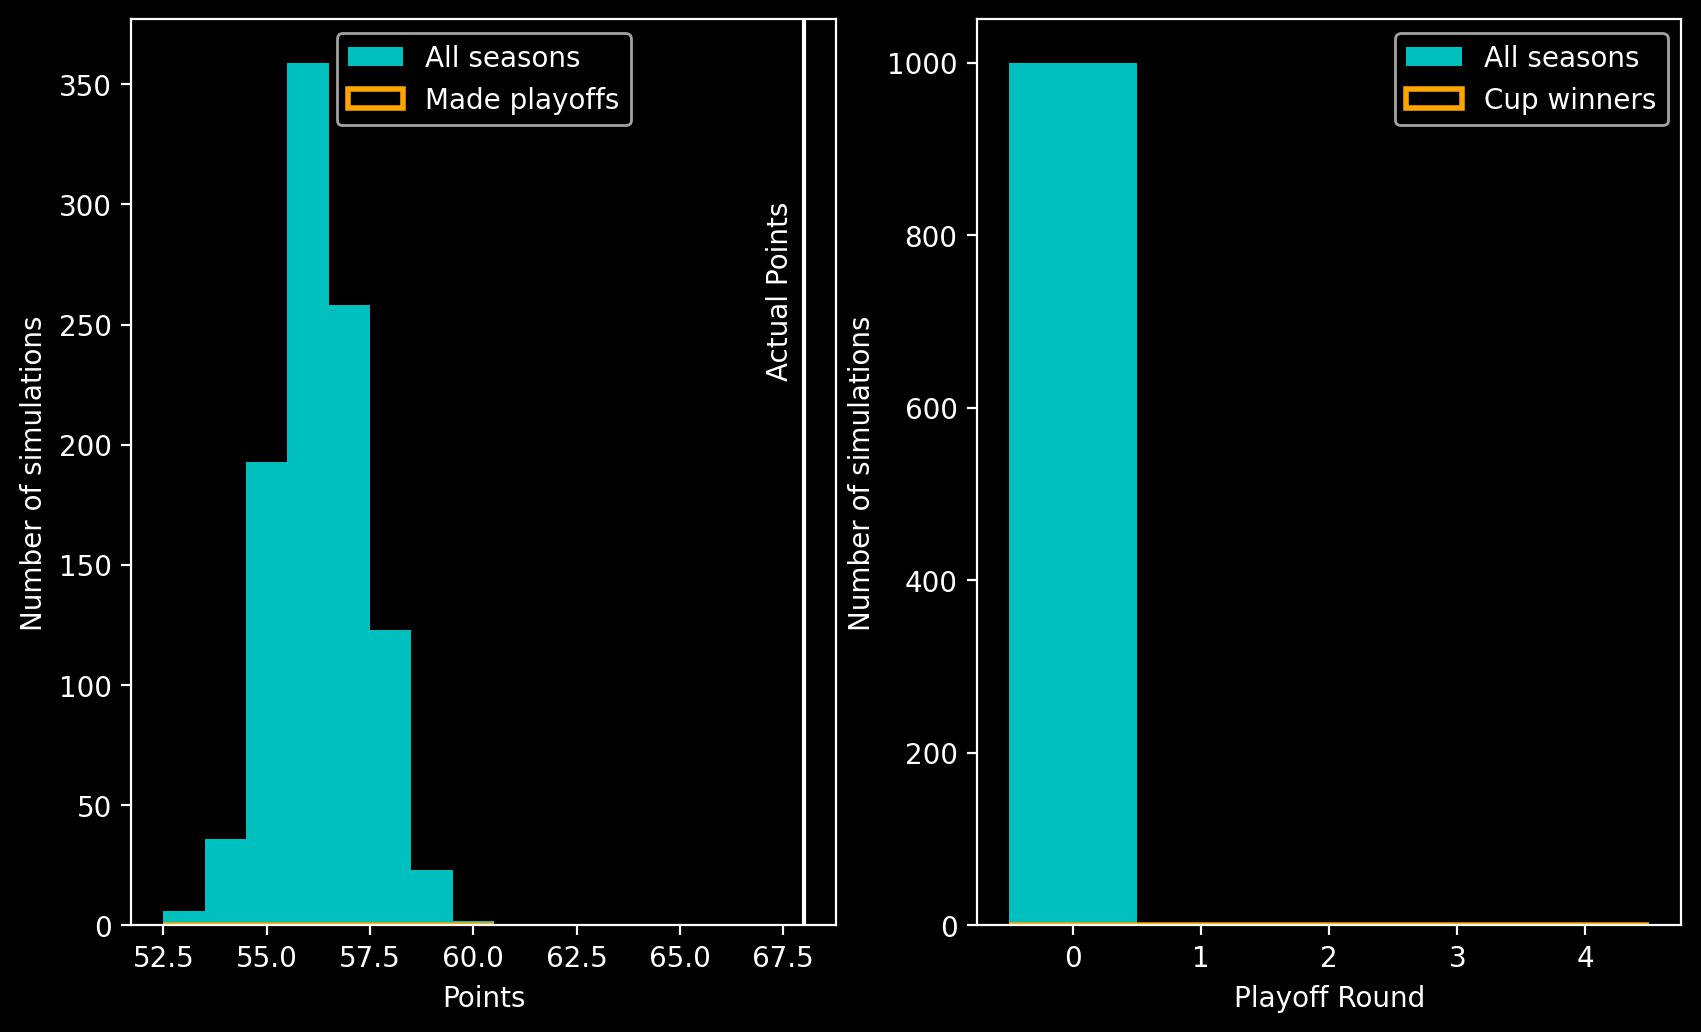
Goalless Gretzky: Gretzky enters the season with only 1838 assists as Gretzky is missing 5 assists that occurred in overtime periods we’ve wiped off. He now needs 12 more to match Gordie Howe’s points record. On November 5th 1997 against the Colorado Avalanche, Gretzky matches Howe’s record, mirroring the real season with a secondary assist on Niklas Sundström’s go-ahead goal. He then breaks Mr Hockey’s points record with another helper on Kevin Stevens power play goal in the 3rd period. In our simulations of the season, the Rangers average 56 points, dropping to 2nd-to-last in the league. Gretzky drops to 24th in the points standings.
1998-99 season (back to list of seasons)
Real season: The New York Rangers finish 10th in the Eastern Conference with 77 points. Gretzky scored 9 goals and had 53 assists in his only season where he was below a point-per-game. Jaromír Jágr won another Art Ross while Gretzky finished in 33rd in the points standings.
Goalless Gretzky: The Rangers average 72 points and fall below the Canadiens in the Eastern Conference standings, missing the playoffs in every simulation. Gretzky drops to 67th in the points standings.
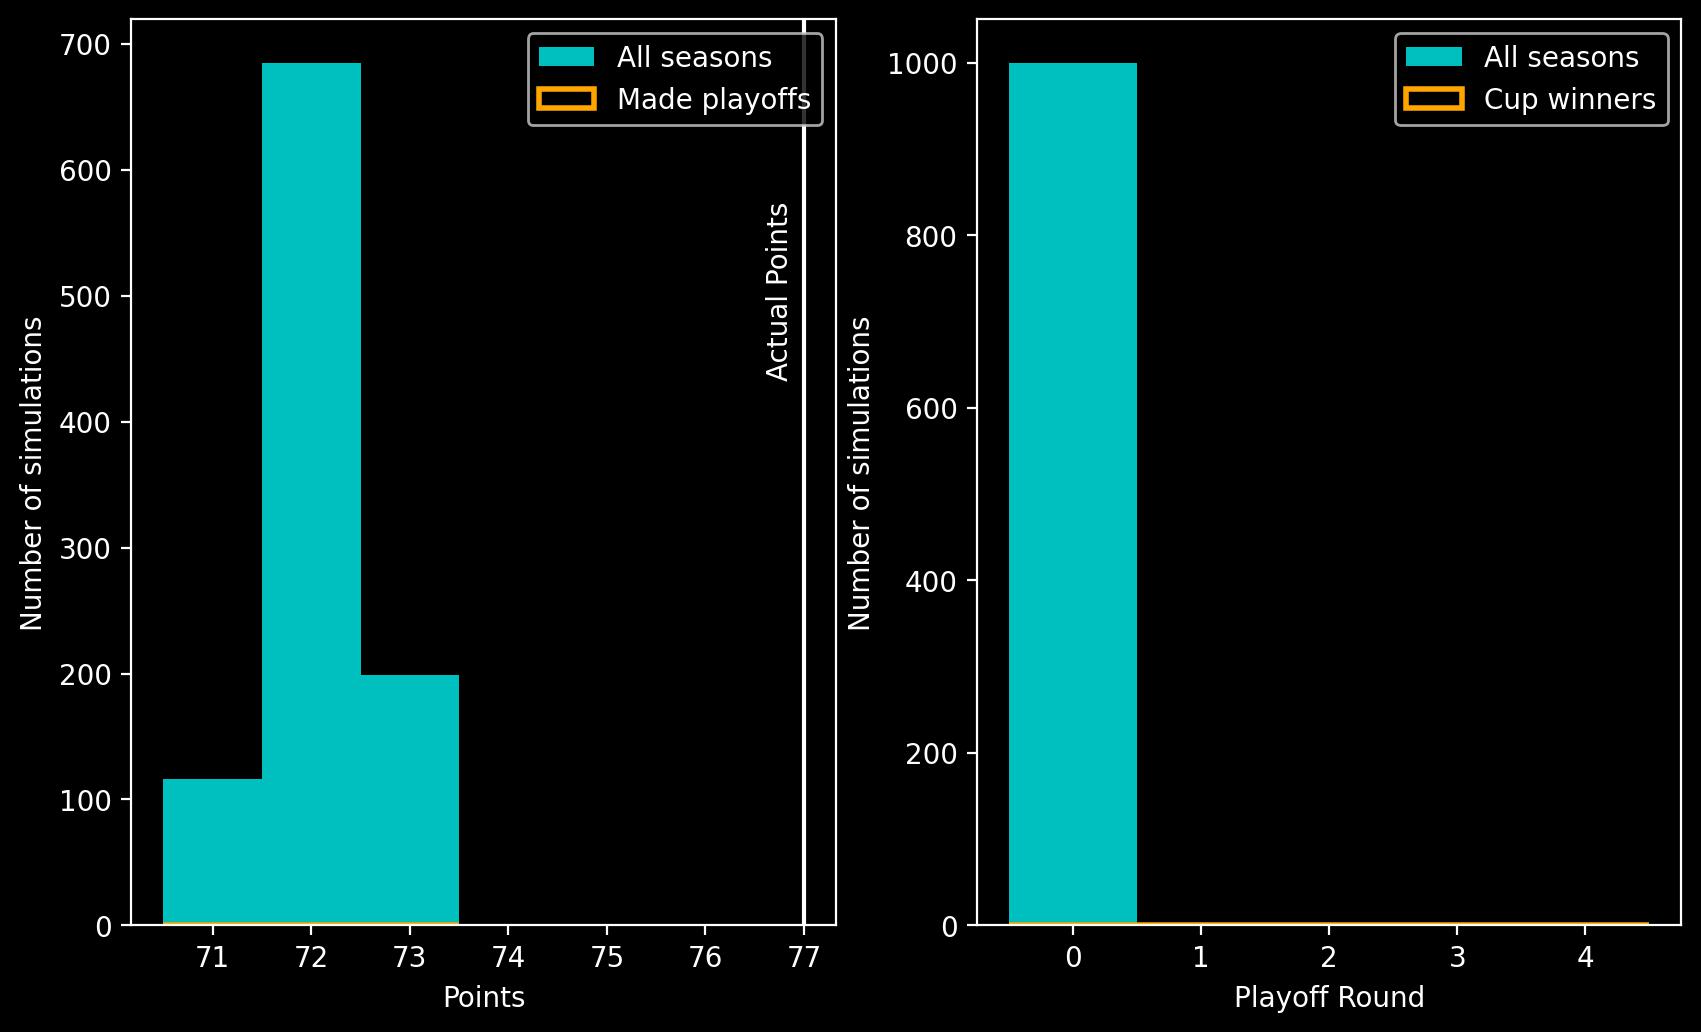
Since Gretzky finished his career, the closest a player has got to his points total is Jaromír Jágr with 1,921 points, who reached this mark against the Arizona Coyotes on 30th November 2017 (at the age of 45 years and 288 days!). Although following the precedent we’ve set of wiping off goals and assists for overtime periods that never occur, in the goalless Gretzky universe, Jágr will finish his career with 1,920 points as he loses an overtime goal from the March 11th 1993 contest between the Kings and the Penguins. Entering his final season, Gretzky had 1,910 assists, although we’ve knocked off 5 overtime assists so he’s down to 1,905. On November 19th 1998 against his former team the Kings, Gretzky’s assist on Alex Kovalev’s 3rd period goal brings his assist total to Jágr’s new future tally of 1,920 points. Gretzky goes pointless for two games but on November 27th 1998 against Jágr’s Penguins, Gretzky’s 1st period assist sets a marker that is yet to be reached by any other player with goals and assists. Jágr went pointless in this game and it would take another 1,158 points in 1,132 games across 19 years and 3 days until he would come within 1 point of the marker set by Gretzky on this night.
Summary (back to list of seasons)
Wayne Gretzky finished his career with 1,963 assists which is 42 more than Jaromír Jágr had points. Although we’ve since reduced this to 1,958 assists in our goalless simulations, but he maintains a 37 points lead over Jágr in the all-time list. Gretzky had fifteen 100-point seasons (including four 200-point seasons) out of the 20 seasons he played in the NHL which reduces to eleven 100-point seasons with a career-high of 163 assists in 1985-86. He still wins 4 Art Ross trophies for leading the league in points plus has another 4 top-five finishes. Looking towards the biggest prize, the Edmonton Oilers are guaranteed to lose the 1987 Stanley Cup to the Philadelphia Flyers and lose out in half the simulations for the 1985 final. Astonishingly, despite Gretzky never scoring a goal, the Oilers are still guaranteed to win Lord Stanley’s Mug in 1984 and 1988.
| Season | Team | Assists (Points) |
Art Ross Position (Real position) |
Art Ross Winner | Real season outcome | Average outcome |
|---|---|---|---|---|---|---|
| 1979-80 | EDM | 86 (137) |
19th (=1st) |
Marcel Dionne | 69 points: Lost 3-0 to PHI in 1st round |
58 points: Missed playoffs |
| 1980-81 | EDM | 109 (164) |
6th (1st) |
Marcel Dionne | 74 points: Lost 4-2 to NYI in 2nd round |
64 points: Missed playoffs |
| 1981-82 | EDM | 120 (212) |
5th (1st) |
Mike Bossy | 111 points: Lost 3-2 to LAK in 1st round |
87 points: Lost to LAK in 1st round |
| 1982-83 | EDM | 125 (196) |
1st (1st) |
Wayne Gretzky | 106 points: Lost 4-0 to NYI in SCF |
93 points: Lost to NYI in SCF |
| 1983-84 | EDM | 116* (205) |
5th (1st) |
Michel Goulet | 119 points: Won Stanley Cup |
90 points: Won Stanley Cup |
| 1984-85 | EDM | 135 (208) |
1st (1st) |
Wayne Gretzky | 109 points: Won Stanley Cup |
88 points: Won Stanley Cup in approx. half our simulations |
| 1985-86 | EDM | 163 (215) |
1st (1st) |
Wayne Gretzky | 119 points: Lost 4-3 to CGY in 2nd round |
105 points: Lost to CGY in 2nd round |
| 1986-87 | EDM | 119* (183) |
1st (1st) |
Wayne Gretzky | 106 points: Won Stanley Cup |
88 points: Lost to PHI in SCF |
| 1987-88 | EDM | 109 (149) |
6th (2nd) |
Mario Lemieux | 99 points: Won Stanley Cup |
94 points: Won Stanley Cup |
| 1988-89 | LAK | 114 (168) |
5th (=1st) |
Mario Lemieux | 91 points: Lost 4-0 to CGY in 2nd round |
71 points: Lost to CGY in 2nd round |
| 1989-90 | LAK | 102 (142) |
11th (1st) |
Mark Messier | 75 points: Lost 4-0 to EDM in 2nd round |
67 points: Lost to EDM in 2nd round |
| 1990-91 | LAK | 122 (163) |
2nd (1st) |
Brett Hull | 102 points: Lost 4-2 to EDM in 2nd round |
90 points: Lost to EDM in 2nd round |
| 1991-92 | LAK | 90 (121) | 17th (3rd) |
Mario Lemieux | 84 points: Lost 4-2 to EDM in 1st round |
75 points: Lost to EDM in 1st round |
| 1992-93 | LAK | 48* (65) |
146th (93rd) |
Mario Lemieux | 88 points: Lost 4-1 to MTL in SCF |
86 points: Lost to TOR in 3rd round |
| 1993-94 | LAK | 92 (130) |
19th (1st) |
Sergei Fedorov | 66 points: Missed playoffs |
53 points: Missed playoffs |
| 1994-95 (lockout shortened) |
LAK | 37 (48) |
63rd (19th) |
Jaromír Jágr | 41 points: Missed playoffs |
35 points: Missed playoffs |
| 1995-96 | LAK/STL | 79 (102) |
36th (12th) |
Mario Lemieux | LAK: 66 points: Missed playoffs |
LAK: 61 points: Missed playoffs |
| STL: 80 points: Lost 4-3 to DET in 2nd round |
STL: 77 points: Missed playoffs |
|||||
| 1996-97 | NYR | 72 (97) |
30th (5th) |
Mario Lemieux | 86 points: Lost 4-1 to PHI in 3rd round |
78 points: Lost to PHI in 3rd round |
| 1997-98 | NYR | 67 (90) |
24th (4th) |
Jaromír Jágr | 68 points: Missed playoffs |
56 points: Missed playoffs |
| 1998-99 | NYR | 53 (62) |
68th (33rd) |
Jaromír Jágr | 77 points: Missed playoffs |
72 points: Missed playoffs |
*assists on overtime winners removed.
How Gretzky’s Points per Game stacks up:
Points per game (PPG) is a useful metric for comparing different player’s seasons and careers when the number of games played could vary somewhat. For example, while Mario Lemieux doesn’t come close to reaching Gretzky’s major statistical totals due to his numerous health problems, he does sit second in all-time points per game with 1.88 PPG to Gretzky’s 1.92 (in fact, prior to his comeback in 2000, Lemieux was above the 2 career PPG threshold). In the plots below, we show the number of players who had a season with each PPG value between 0 and 2.77 (the highest single-season PPG, Gretzky’s 1983-84 season). We include a minimum of 10 games to prevent outliers such as: Ryan Poehling’s 2018-19 “season” where he made his NHL debut in Montreal’s final game of the regular season and promptly scored a hat-trick, therefore giving him the joint single season record of 3 points-per-game (tied with Bill Kyle and Richard Kromm).
Before looking at single-season values, let’s look at career points per game. Gretzky’s reduced total of 1,958 points in 1,487 games gives him 1.32 points-per-game which drops him to 5th in the Career Leaders list, behind Lemieux, Mike Bossy, Connor McDavid and Bobby Orr. At time of writing, McDavid would have to go pointless for around 60 games to drop back below Gretzky. Meanwhile, Sidney Crosby, who currently sits around 8th on the list, would need to score at a pace of 1.6 points-per-game for the remainder of his current contract to overtake Gretzky in 5th place.
Considering every season played by a player since the inaugural season of the NHL in 1917-18 (through until the 2021-22 season), here is the distribution of PPGs, including Gretzky with his goals (if you zoom in around 2.77 you’ll see his 1983-84 season).
Now let’s remove Gretzky’s goals (and the 5 assists). Each orange line shows the points-per-game for one of The Great One’s seasons. We can already see Gretzky still has a few seasons that remain true outliers and all his seasons lie well-above the average. If you zoom in on the top end again, you’ll find a host of Mario Lemieux’s seasons (including the 1992-93 season (2.67 PPG) and 1988-89 season (2.62 PPG)) as well as Joe Malone (2.4 PPG), Cy Denneny (2.19 PPG) and Newsy Lalonde (2.14 PPG) from the 1917-18 season, whose goal scoring feats place them atop the Single Season Leaders for Goals per Game. If we were to do this same exercise with Joe Malone’s 1917-18 season then it would surely decimate the Canadiens record as he led the team in points with 44 goals and only 4 assists in 20 games played.
The full picture is useful but now let’s zoom in on the top 15% of all NHL seasons by points per game. This equates to any season with more than 0.74 PPG which still includes Gretzky’s worst season for assists-per-game at 0.76 in his final season.
Let’s zoom in further. Now we’re looking at the top 1% of all NHL seasons by PPG and we still have 11 (eleven!) of Gretzky’s seasons despite him never scoring a goal. Over half of Wayne Gretzky’s seasons without goals are better than 99% of all NHL seasons!
It’s time to go deeper. This final plot shows the top 0.1% of all NHL seasons by PPG and still, we see that orange line, meaning that Wayne Gretzky’s 1985-86 season, where he had 163 assists in 80 games, is in the top 0.1% of all NHL seasons with a 2.04 points-per-game. In fact, there are only 11 NHL seasons with higher points-per-game which are annotated on the plot below.
Playoffs:
In 208 playoff games, Wayne Gretzky had 122 goals and 260 assists for 382 points. However in our goalless scenario, Gretzky misses the playoffs three extra times and has a few early eliminations, plus some goals and assists are lost due to overtime periods that no longer occur. This causes Gretzky to lose 38 playoff assists which would drop him to 3rd in all-time playoff points leaders. However the next three players in the standings are Mark Messier, Jari Kurri and Glenn Anderson who all played with Gretzky for extended periods and as a result they also see their points totals dwindle. Messier loses only 25 points as he was not a regular linemate of Gretzky, which allows him to take the new top spot in the standings. Meanwhile, Jari Kurri and Glenn Anderson drop below Jágr and Sidney Crosby (at time of writing, midway through the 22-23 regular season, Crosby has 201 career playoff points).
| Rank (Previous) | Player | GP | Goals | Assists | Points |
|---|---|---|---|---|---|
| 1 (2) | Mark Messier | 222 (236) | 105 (109) | 165 (186) | 270 (295) |
| 2 (1) | Wayne Gretzky | 176 (208) | 0 (122) | 222 (260) | 222 (382) |
| 3 (5) | Jaromír Jágr | 208 | 78 | 123 | 201 |
| 4 (6) | Sidney Crosby | 180 | 71 | 130 | 201 |
| 5 (3) | Jari Kurri | 185 (200) | 98 (106) | 91 (127) | 189 (233) |
| … | … | … | … | … | … |
| 14 (4) | Glenn Anderson | 204 (225) | 86 (93) | 92 (121) | 178 (214) |
Gretzky’s biggest assisters:
Jari Kurri: Kurri played 8 seasons with Gretzky at Edmonton from 1980 to 1988 and was then reunited with Gretzky at LA for 4¾ seasons from 1991 until early 1996 when Gretzky was traded to St. Louis. Kurri was traded to the Rangers shortly afterward but left before Gretzky signed with New York.
In the regular season, he had assists on 196 of Gretzky’s goals, which we remove. In addition, the Finnish Flash loses 2 overtime goals and 3 overtime assists in overtime periods forced by Gretzky goals. Losing these two goals moves Kurri out of the 600-goals club (601 down to 599) while his loss of 199 assists means he finishes his career with 598 assists (still enough for top 100 in assists). In total, Kurri finishes with 1197 points which keeps him in the top 50 all-time for points.
Paul Coffey: Coffey played 7 seasons with Gretzky at Edmonton from 1980 to 1987 and was reunited with Gretzky and Kurri for parts of two seasons, from 1992 to 1993. Coffey loses his 116 assists on Gretzky goals, 2 overtime assists, as well as his only overtime game-winning goal of his career, scored against the Quebec Nordiques on March 13th 1984. This drops Coffey to 1412 points for 21st in the all-time points leaders. Although this is still enough to remain comfortably second all-time for goals, assists and points for NHL defencemen.
Mark Messier: Messier played 9 seasons with Gretzky at Edmonton from 1979 to 1988 and played with Gretzky in New York during the 1996-97 season. Despite not being a regular linemate, Messier was the third-most common assister of Gretzky with assists on 68 of The Great One’s goals. In addition to losing these assists, he also loses 2 overtime goals and an overtime assist. Although the loss of his OT goal on January 27th 1994 won’t sting too badly as instead of a 5-4 OT win for New York at LA, it ends a 4-3 regulation win as Gretzky’s power play marker is wiped off. These changes drop Messier below Gordie Howe and into 4th position in the all-time points leader standings.
The Zero Point Club: Todd Strueby loses the only NHL point of his 5 game career which came on November 19th 1983 against the New Jersey Devils during the 2nd period of a 13-4 blowout.
Similarly, Bob Jay loses the only NHL point of his 3 game career. A secondary assist on Gretzky’s 2nd period goal in a 3-2 loss to New York on October 24th 1993.
Miscellaneous:
Wayne Gretzky had four 5-goal games in his career, however only the contest to be affected by his goal drought is the December 30th 1981 game between the Philadelphia Flyers and Edmonton Oilers which is flipped from a 7-5 win for Edmonton to a 5-2 loss.
Wayne Gretzky scored 10 goals on his birthday (January 26th), including hat-tricks on his 24th and 30th birthdays against Pittsburgh and Vancouver respectively. After removing Gretzky’s goals, Phil Esposito’s 10 birthday goals (February 20th) give him sole leadership of this niche statistical category. Interestingly Esposito didn’t score a birthday goal until his 29th birthday, in what was his 8th season in the NHL.
Appendix
1979-80 season (back to list of seasons)
Real season: The Edmonton Oilers had a 28-39-13 record to finish 4th in the Smythe Division. They made the playoffs but lost 3-0 to the Philadelphia Flyers in the preliminary round. Gretzky had 51 goals and 86 assists for 137 points to tie with Marcel Dionne for the league lead in points but Dionne won the Art Ross due to having two more goals than Gretzky.
Goalless Gretzky: The Oilers drop to a 24-46-10 record for a final points total of 58 and a 19th place finish in the league. They miss the playoffs, finishing 15th best of the non-Division winners and the Washington Capitals instead take their place. Marcel Dionne comfortably wins the Art Ross by 12 points over Guy Lafleur. Wayne Gretzky’s 86 points are enough for a 19th place finish. A quick glance shows 86 points would give him 20th spot but we also have to remove the 19 times Blair MacDonald assisted Wayne, dropping MacDonald down to 32nd place. Looking at playoff points, Gretzky loses two goals and an assist as the Oilers don’t make the playoffs.
1980-81 season (back to list of seasons)
Real season: The Oilers had a 29-35-16 record to finish 4th in the Smythe once again. They made the playoffs where they swept the Montreal Canadiens 3-0 in the Preliminary Round before losing 4-2 to the New York Islanders in the Quarterfinals. The Great One had 55 goals and 109 assists to win the Art Ross by 29 points over Marcel Dionne.
Goalless Gretzky: Edmonton slump to 27-43-10 and miss the playoffs again, finishing 6 points behind the Capitals for the final playoff place. Marcel Dionne wins a second Art Ross by 4 points over Kent Nilsson while Gretzky finishes in 6th place. Playoffs: Gretzky loses 7 goals and 14 assists as the Oilers don’t make the playoffs.
1981-82 season (back to list of seasons)
Real season: Edmonton topped the Smythe with a 48-18-15 record before losing 3-2 to the LA Kings in the best-of-five Division Semifinals. Wayne Gretzky had the first of his four 200-point seasons and had his best goal haul with 92 goals. Adding his 120 assists for 212 points allows him to walk away with the Art Ross Trophy.
Goalless Gretzky: The Oil maintain a winning record of 35-28-17 and stay top of the Smythe Division by 9 points over the now tied Canucks and Flames. In his first taste of playoff hockey, Gretzky faces the LA Kings who have an easier job dispatching of the Oilers as The Great One doesn’t score the OT game winner in Game Two. This means that the Kings have a chance to win the series in 4 games, although they’re still guaranteed to advance regardless. In the Art Ross race, Mike Bossy wins the trophy while Gretzky has his first top 5 finish. Playoffs: Gretzky loses his 5 goals.
1988-89 season (back to list of seasons)
Real season: Gretzky was traded to the LA Kings in “The Trade.” The Kings finished the season with 91 points for 2nd in the Smythe. In the playoffs, they overturned a 3-1 series deficit to beat the Oilers in Game Seven of the Division Semifinals before being swept by the Flames in the next round. Gretzky finished second to Mario Lemieux in the Art Ross standings, tying on assists with 114 each but losing out on goals with 54 to Mario’s 85.
The Kings average only 71 points but still squeak into the playoffs in every simulation. In the first round of the playoffs, the Kings still beat the defending champions and Gretzky’s old team, the Oilers, but are of course swept by the Flames in the Division Finals in every remaining simulation. Lemieux leads the league in scoring by 44 points from Steve Yzerman as Gretzky falls further back to 5th place. Playoffs: 5 goals lost.
1989-90 season (back to list of seasons)
Real season: Gretzky’s team finished with a losing record for only the third time in his career as the Kings managed only 75 points and placed 4th in their division. Gretzky misses the first two games of the playoffs against the Flames but returns to help his team beat the defending champions. Unfortunately, he can do nothing to prevent his side being swept by the Oilers in the next round. After two seasons losing the scoring race to Lemieux, Gretzky returned to the top, beating Mark Messier by 13 points as an injury-plagued Lemieux managed only 59 games and 123 points. This season saw The Great One become the all-time leading scorer in NHL history, surpassing Gordie Howe’s 1,850 points.
Goalless Gretzky: The Kings average 67 points and make the playoffs in all of our simulations. The Flames win the Division Semifinals in 258 of the simulations after winning Game Six 3-2 to force Game Seven. In the remaining 742 simulations, the Oilers have no trouble sweeping the Kings in the 2nd round on their way to winning another Stanley Cup, this time without The Great One.
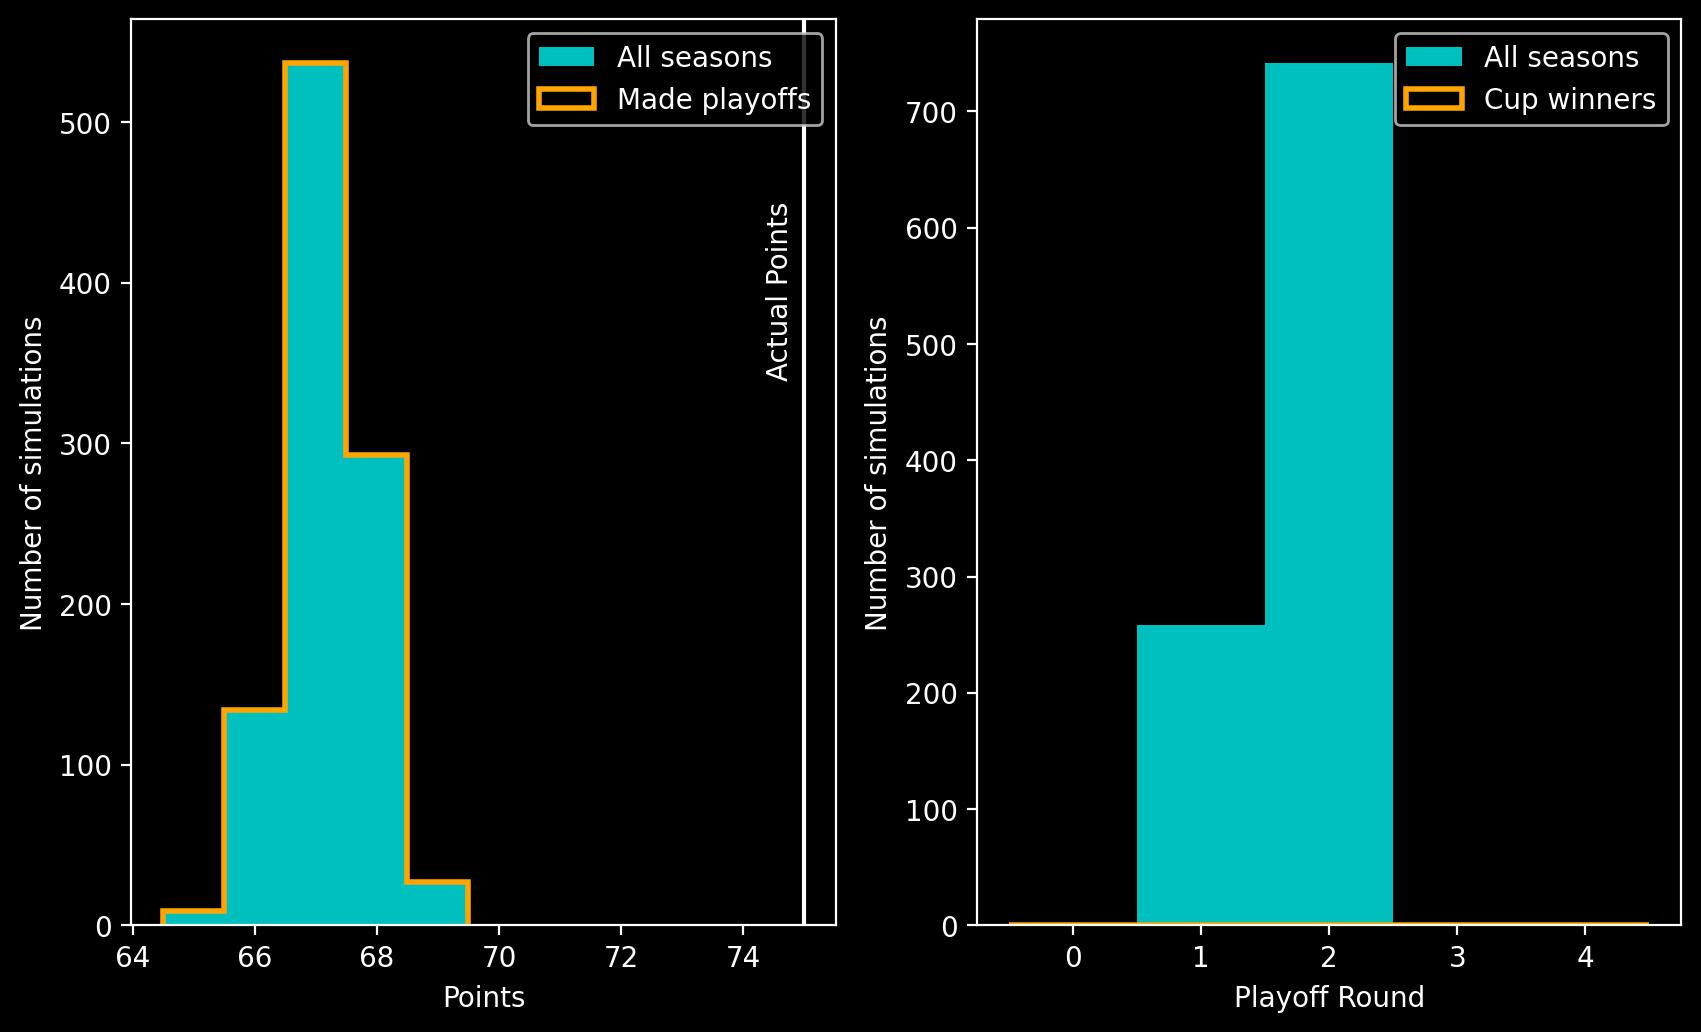
Gretzky is still 552 points off Gordie Howe’s points record in our goalless scenario and drops to 11th in this season’s points race. Playoffs: 3 goals lost.
1990-91 season (back to list of seasons)
Real season: LA bounced back to top the Smythe with 102 points. They beat the Canucks in the Division Semifinals but lost to the Oilers in the Division Finals for the second year running. Gretzky won his 9th Art Ross by 32 points over Brett Hull.
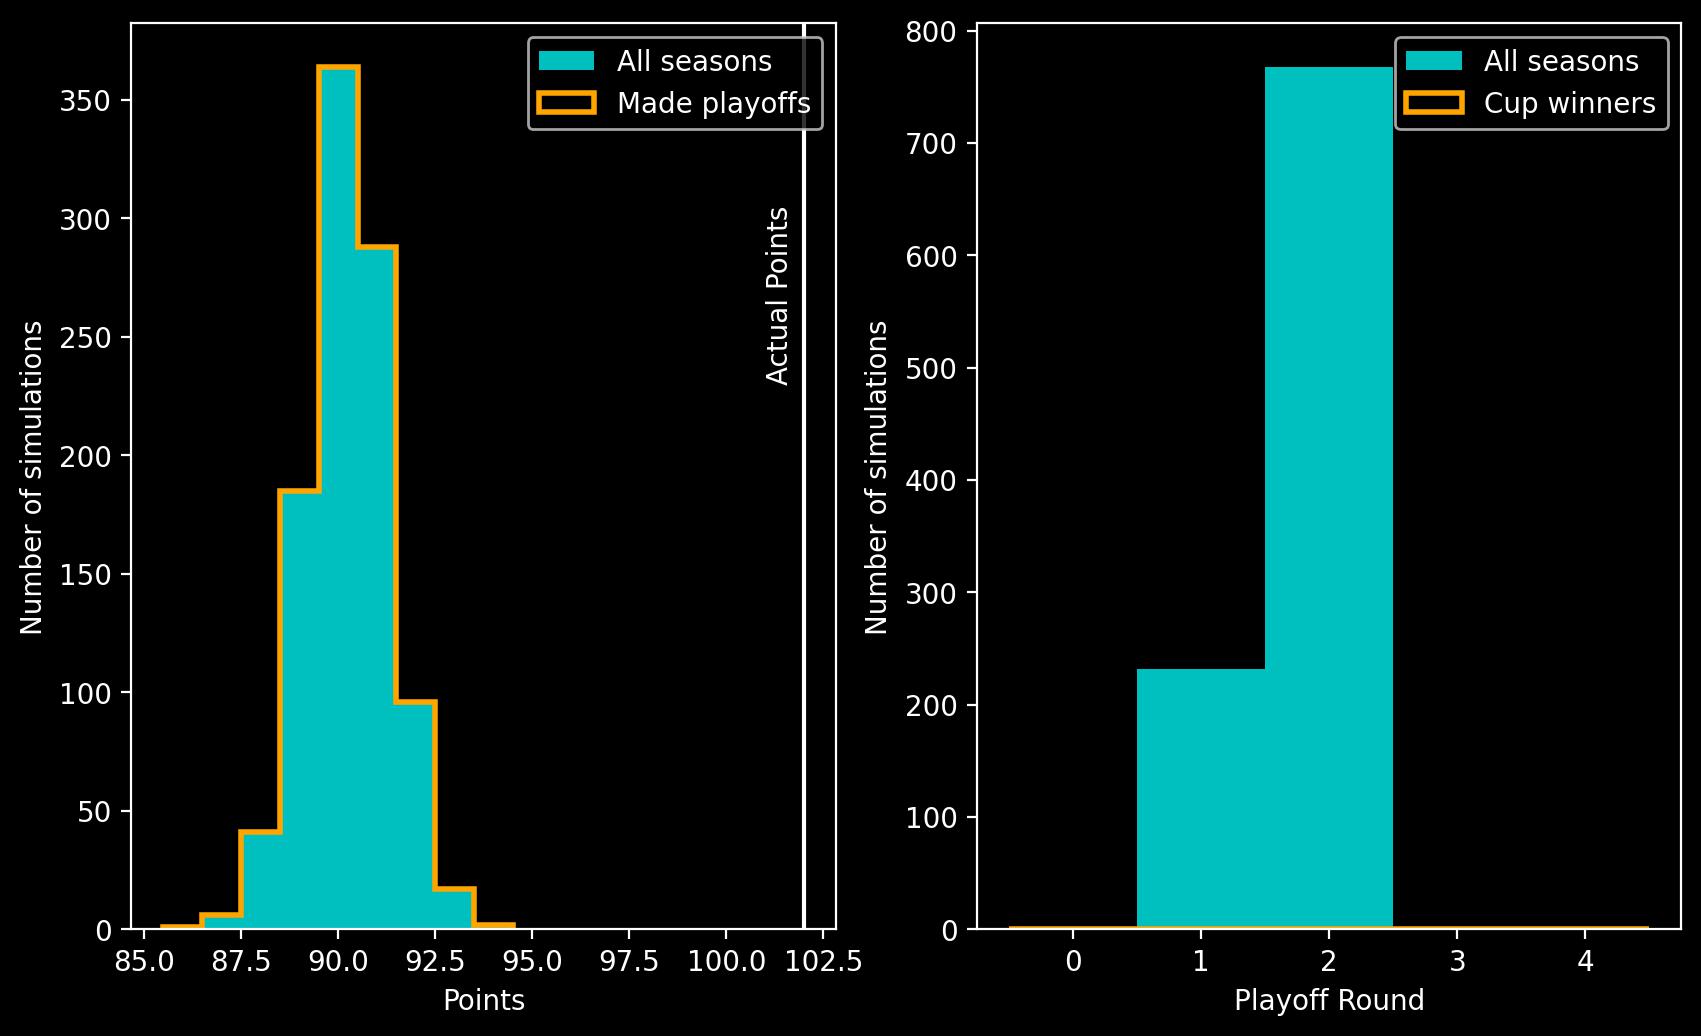
Goalless Gretzky: The Kings average 90 points and make the playoffs in every simulation. The Canucks get the better of the Kings in 232 of our simulations while the Oilers are victorious in the remaining 768 simulations where the Kings make it past the first round. Brett Hull wins the Art Ross by 9 points over Gretzky. Playoffs: 4 goals lost.
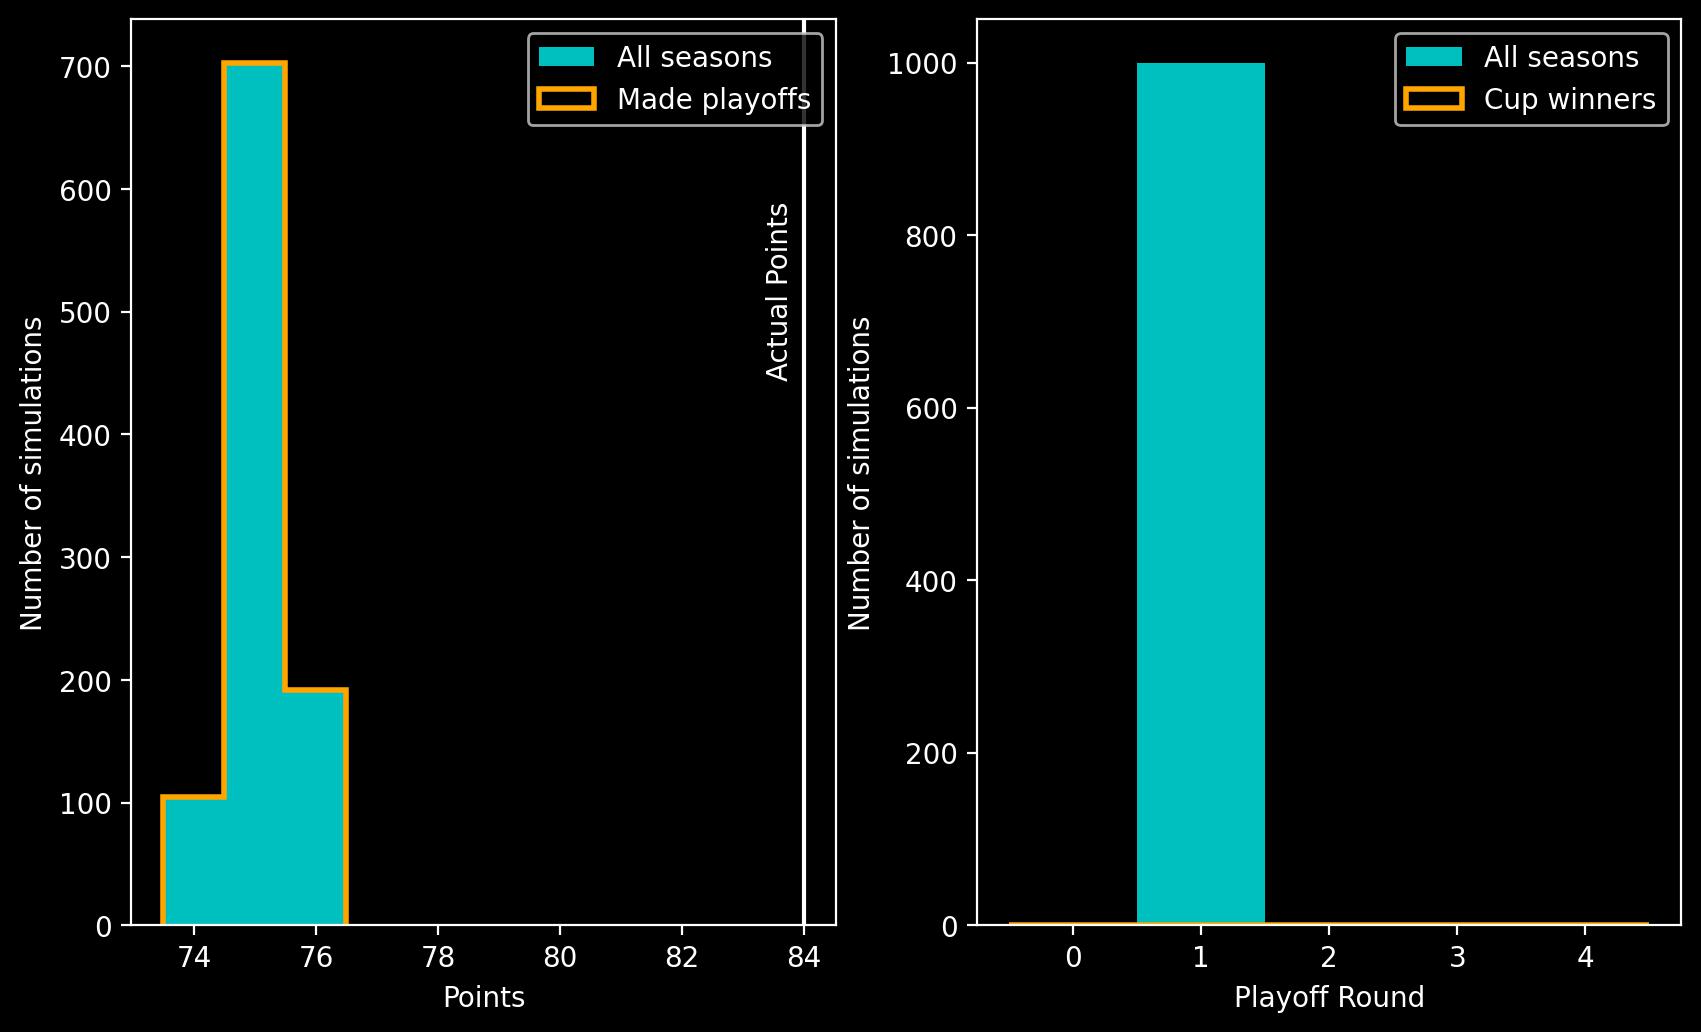
1991-92 season (back to list of seasons)
Real season: The Kings finished second in their division with 84 points but lost to the Oilers in the playoffs once again, this time in the Division Semifinals. Mario Lemieux topped the scoring standings while Gretzky had his lowest finish in the Art Ross race to date, 3rd.
Goalless Gretzky: The Kings average 75 points and make the playoffs in every one of our simulations, however they promptly lose to the Oilers in the first round. Gretzky has only his second season with less than 100 assists and drops to 17th in the points standings. Playoffs: 2 goals lost.
1992-93 season (back to list of seasons)
Real season: The Kings finished 3rd in the Smythe with 88 points and made the playoffs. They beat the Flames, Canucks and Maple Leafs to reach the finals but lost 4-1 to the Montreal Canadiens. Wayne Gretzky’s injury-hit season meant he only managed 45 games and 65 points for a 93rd place finish in the points standings.
Goalless Gretzky: While missing Gretzky hurt the Kings, it does mean that they don’t lose quite so much ground when his goals are removed as they finish with 86 points in every simulation with the only result flip coming against the San Jose Sharks on April 10th 1993 as Gretzky’s missing goal means the game finishes 2-1 to the Sharks. In addition, Gretzky loses an assist as he had assisted the overtime winner in the real game against the Sharks.
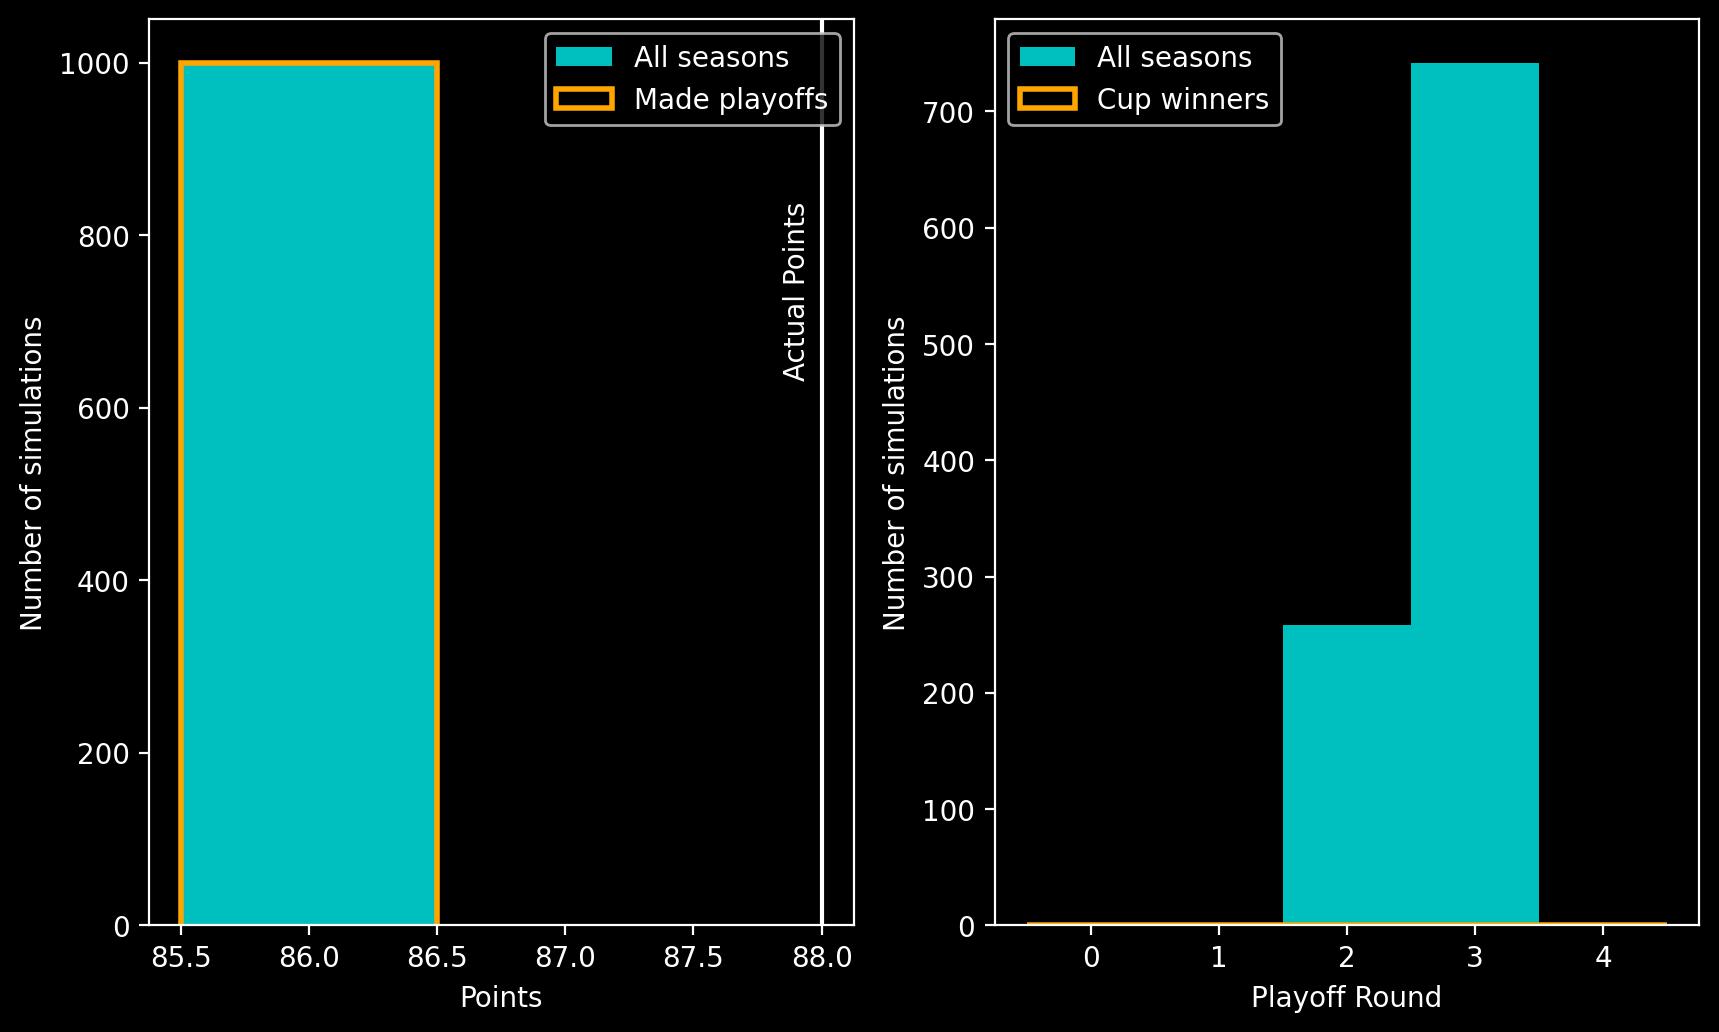
The Kings make the playoffs in every simulation and beat the Flames in the first round without fail. In 258 simulations the Vancouver Canucks defeat the Kings in the 2nd round. In the remaining 742 simulations, Gretzky’s Game Six game-winning OT goal never occurs in the Conference Finals, allowing the Maple Leafs a chance to win the series there and then. If the Kings win Game Six, they’re guaranteed to lose Game Seven as Gretzky’s hat-trick is wiped off which allows the Maple Leafs to reach their first finals since 1967. Mario Lemieux wins the Art Ross and Gretzky drops to 146th in the points standings. Playoffs: Gretzky loses his 15 goals and 5 assists as the Kings are guaranteed to not make the finals. This drops him to tied 3rd in the points standings although Wendel Clark and Ray Ferraro of course have superior goal totals. Dave Andreychuk and Glenn Anderson are likely to also pull ahead of Gretzky as they play for the Maple Leafs who now make the finals in our simulations.
1993-94 season (back to list of seasons)
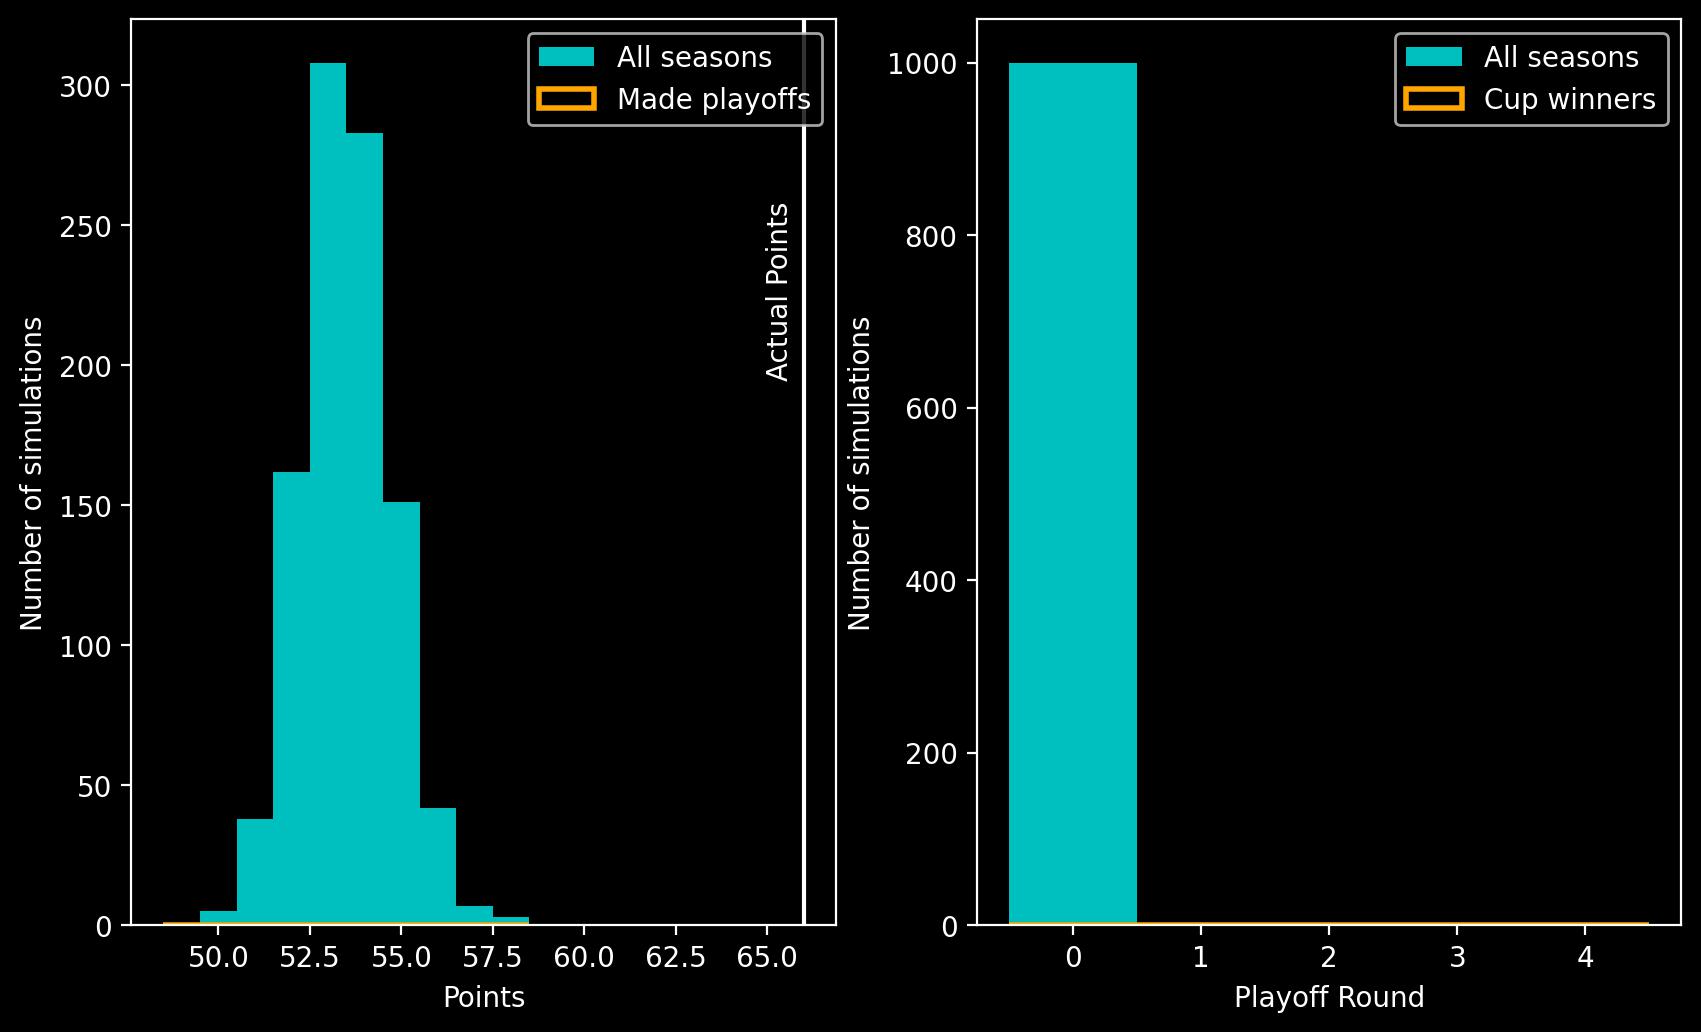
Real season: The Kings had a poor season finishing 5th in the Pacific Division and 10th in the Western Conference, their 66 points weren’t enough for a playoff berth. This is the first season where Gretzky missed the playoffs in his NHL career. Individually Gretzky had a good season as he claimed his 10th and final Art Ross by 10 points over Sergei Fedorov.
Goalless Gretzky: The LA Kings average a mere 53 points to finish 2nd-to-last in the league (they still aren’t as bad as the 14-61-9 Senators). Gretzky drops to 19th in the points standings as Federov claims the Art Ross.
1994-95 season (back to list of seasons)
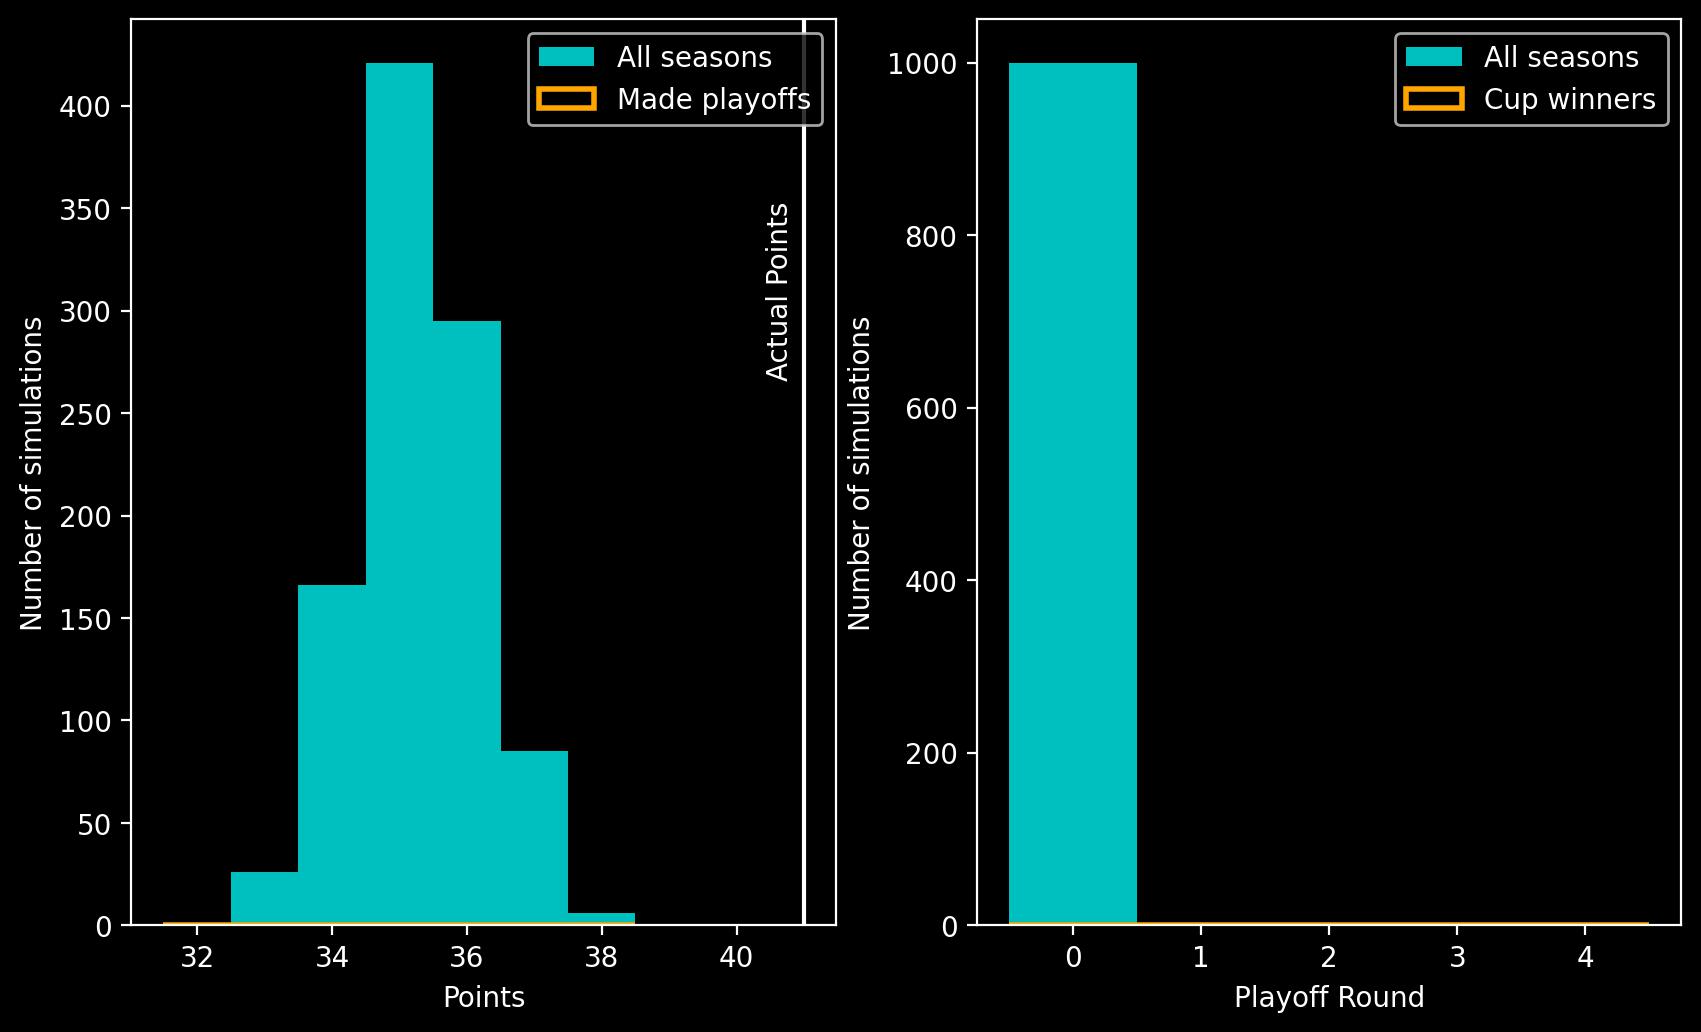
Real season: In a lockout-shortened season, the Kings finished 16-23-9 for 41 points and 9th in the Western Conference, missing out on the playoffs by a point. Jaromír Jágr won his first Art Ross while Gretzky finished down in 19th place with only 48 points in 48 games.
Goalless Gretzky: The Kings average 35 points, dropping to the bottom of the Pacific Division. Gretzky drops to 63rd in the points standings in his first season below 1 assist-per-game.
1995-96 season (back to list of seasons)
Real season: Gretzky played 62 games with the Kings before being traded to the St. Louis Blues. The Kings posted a 24-40-18 record (18-31-15 at the time of Gretzky’s trade) for 66 points causing them to miss the playoffs. When Gretzky joined the Blues they were 26-24-11 and helped them to a final record of 32-34-16 for 80 points. The Blues made the playoffs where they beat the Toronto Maple Leafs in the first round before losing to the Detroit Red Wings thanks to Steve Yzerman’s famous double-overtime Game Seven winner. Gretzky bounced back from the previous season to record his 15th and final 100-point season and finish 12th in the points race, which was won by Mario Lemieux.
Goalless Gretzky: L.A. Kings: With the Kings, Gretzky’s goal drought means they fall to an average of 61 points and of course miss the playoffs.
St. Louis Blues: Following his trade to the St. Louis Blues, Gretzky plays 18 regular season games with three ties being flipped to losses. This means that the Blues drop to 77 points and out of the playoff places as the Mighty Ducks take their place. In all our simulations, Gretzky never lost it to Yzerman because he never had it. Gretzky falls to 36th place in the points standings. Playoffs: Gretzky loses 2 goals, 14 assists as the Blues didn’t make playoffs.
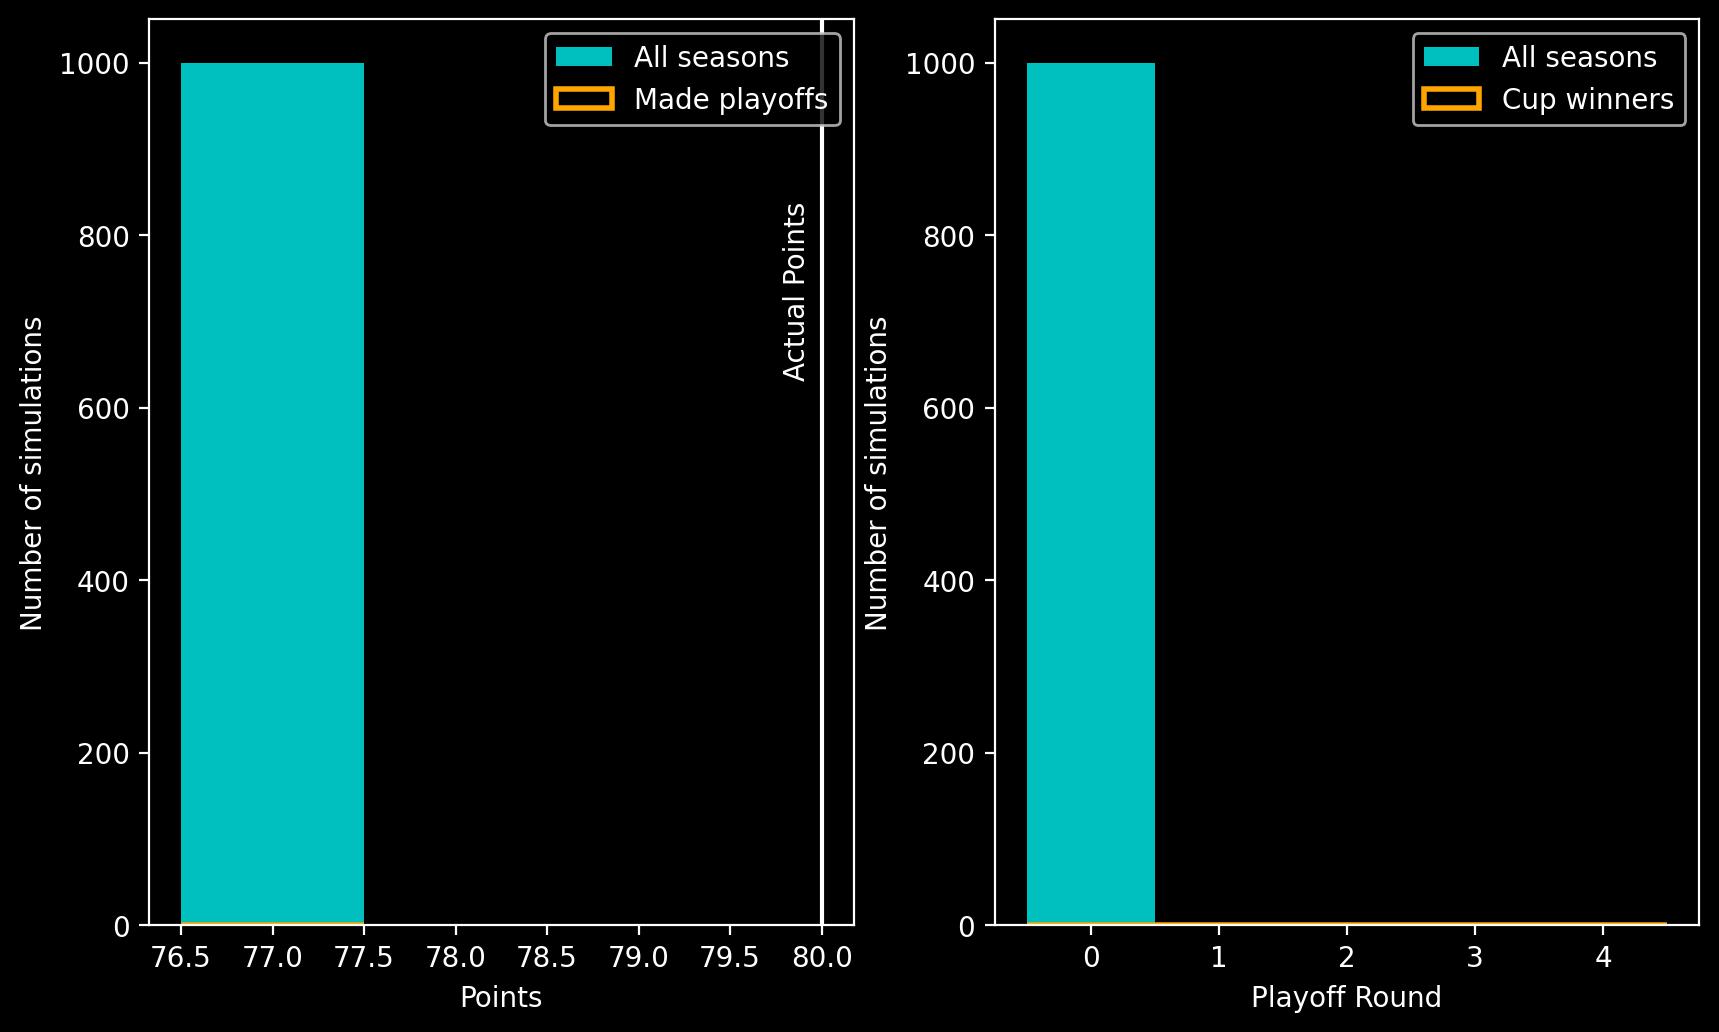
1996-97 season (back to list of seasons)
Real season: Gretzky signed for the New York Rangers where he played out the final three seasons of his career. In his first season with the Rangers, he helped them to 5th place in the Eastern Conference with 86 points and they progressed all the way to the Conference Finals where they lost to the Flyers. Mario Lemieux wins his 6th and final Art Ross while Gretzky finishes in 5th with 97 points.
Goalless Gretzky: The Rangers average 78 points and secure a playoff berth in 980 of our simulations. In the first round against the Florida Panthers, the lack of Gretzky’s Game Four hat-trick allows the Panthers to get the better of New York in 198 of the simulations. In the second round, Game Three goes to overtime which lets the New Jersey Devils win the Battle of the Hudson River in 72 of our simulations. In the remaining 710 simulations, the Flyers sweep the Rangers after Game Two is flipped from a 5-4 NYR win to a 4-2 Philly win. Gretzky falls to 30th in the points standings. Playoffs: Greztky loses 10 goals from this playoff run and 2 assists from the Game Five that never occurred.
